
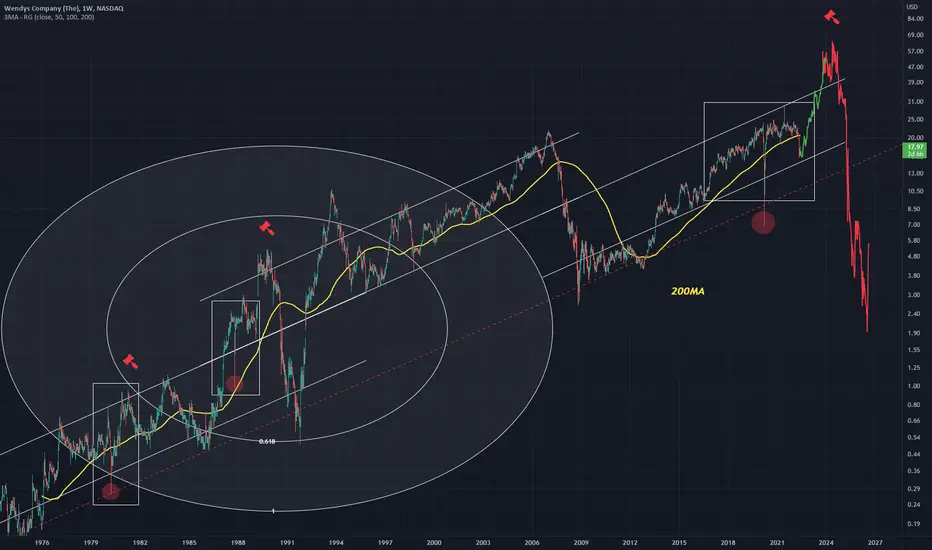
Many up channels can be drawn on chart
The lower red dotted line can be seen as a point of retesting
A common pattern can be observed in white rectangle, which shows a large wick (red circle)
I assume this pattern will repeat just on a larger scale, causing a short lived price rise, followed by a large dump, below the red line
The lower red dotted line can be seen as a point of retesting
A common pattern can be observed in white rectangle, which shows a large wick (red circle)
I assume this pattern will repeat just on a larger scale, causing a short lived price rise, followed by a large dump, below the red line

คำจำกัดสิทธิ์ความรับผิดชอบ
ข้อมูลและบทความไม่ได้มีวัตถุประสงค์เพื่อก่อให้เกิดกิจกรรมทางการเงิน, การลงทุน, การซื้อขาย, ข้อเสนอแนะ หรือคำแนะนำประเภทอื่น ๆ ที่ให้หรือรับรองโดย TradingView อ่านเพิ่มเติมใน ข้อกำหนดการใช้งาน
คำจำกัดสิทธิ์ความรับผิดชอบ
ข้อมูลและบทความไม่ได้มีวัตถุประสงค์เพื่อก่อให้เกิดกิจกรรมทางการเงิน, การลงทุน, การซื้อขาย, ข้อเสนอแนะ หรือคำแนะนำประเภทอื่น ๆ ที่ให้หรือรับรองโดย TradingView อ่านเพิ่มเติมใน ข้อกำหนดการใช้งาน