
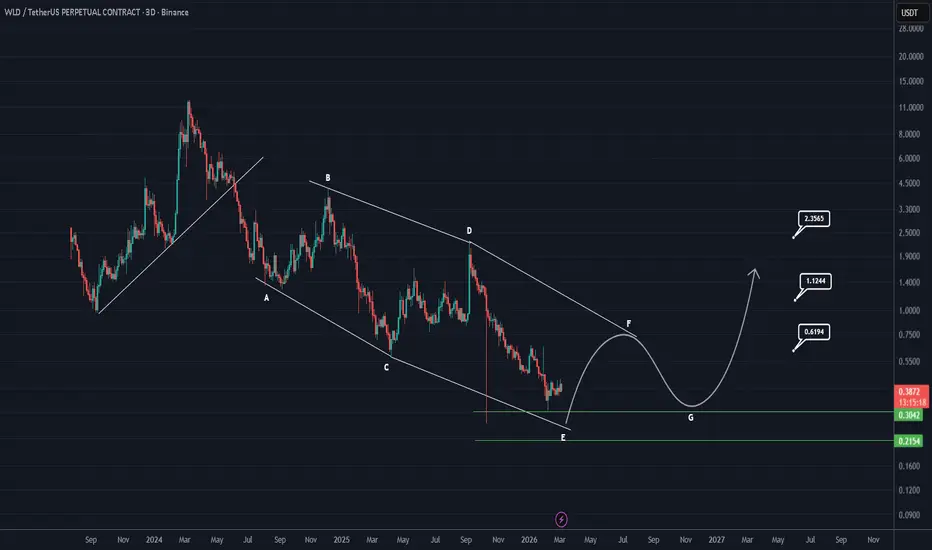
Price action appears to be forming and completing a Diamond Diametric pattern, and based on the current structure we are most likely in Wave E of this formation. Diametric patterns typically consist of seven waves (A–G) and often develop in complex corrective phases, gradually expanding and contracting before the final move.
At the moment, the green zone highlighted on the chart represents a key area of interest where Wave E could potentially complete. If the structure plays out as expected, we anticipate the price to react from this zone and begin Wave F, which would likely lead to a bullish move to the upside.
For traders looking to participate in this setup, the green zone can be considered an accumulation area. Rather than entering with a full position at once, a DCA (Dollar-Cost Averaging) approach may provide better risk management. Gradually building a position within this zone allows traders to reduce entry risk and adapt to potential short-term volatility.
In terms of trade management, once price reaches the first target level, it would be prudent to move the stop loss to break-even. This helps protect capital while allowing the position to continue running if the bullish scenario unfolds.
From a mid-term perspective, this is the general path we are currently anticipating for WLD. As always, market structure and momentum should be monitored closely, since invalidation of the pattern could occur if price breaks significantly below the expected support area.
This analysis represents a probabilistic scenario, not financial advice. Always apply proper risk management and wait for confirmation before entering any trade.
If you have a coin or altcoin you want analyzed, first hit the like button and then comment its name so I can review it for you.
What do you think? Is QNT Bullish?
At the moment, the green zone highlighted on the chart represents a key area of interest where Wave E could potentially complete. If the structure plays out as expected, we anticipate the price to react from this zone and begin Wave F, which would likely lead to a bullish move to the upside.
For traders looking to participate in this setup, the green zone can be considered an accumulation area. Rather than entering with a full position at once, a DCA (Dollar-Cost Averaging) approach may provide better risk management. Gradually building a position within this zone allows traders to reduce entry risk and adapt to potential short-term volatility.
In terms of trade management, once price reaches the first target level, it would be prudent to move the stop loss to break-even. This helps protect capital while allowing the position to continue running if the bullish scenario unfolds.
From a mid-term perspective, this is the general path we are currently anticipating for WLD. As always, market structure and momentum should be monitored closely, since invalidation of the pattern could occur if price breaks significantly below the expected support area.
This analysis represents a probabilistic scenario, not financial advice. Always apply proper risk management and wait for confirmation before entering any trade.
If you have a coin or altcoin you want analyzed, first hit the like button and then comment its name so I can review it for you.
What do you think? Is QNT Bullish?
การซื้อขายยังคงดำเนินอยู่
In the bear market, it moved to complete Wave F and has pumped more than 60% from the upper part of the entry zone so far.
✅ Join our Telegram channel to succeed in crypto trading.
💎Our CRYPTO Telegram Channel: 👉 t.me/Behdark_EN
💎Our FOREX Telegram Channel: 👉 t.me/FX_Behdark
💎Our CRYPTO Telegram Channel: 👉 t.me/Behdark_EN
💎Our FOREX Telegram Channel: 👉 t.me/FX_Behdark
คำจำกัดสิทธิ์ความรับผิดชอบ
ข้อมูลและบทความไม่ได้มีวัตถุประสงค์เพื่อก่อให้เกิดกิจกรรมทางการเงิน, การลงทุน, การซื้อขาย, ข้อเสนอแนะ หรือคำแนะนำประเภทอื่น ๆ ที่ให้หรือรับรองโดย TradingView อ่านเพิ่มเติมใน ข้อกำหนดการใช้งาน
✅ Join our Telegram channel to succeed in crypto trading.
💎Our CRYPTO Telegram Channel: 👉 t.me/Behdark_EN
💎Our FOREX Telegram Channel: 👉 t.me/FX_Behdark
💎Our CRYPTO Telegram Channel: 👉 t.me/Behdark_EN
💎Our FOREX Telegram Channel: 👉 t.me/FX_Behdark
คำจำกัดสิทธิ์ความรับผิดชอบ
ข้อมูลและบทความไม่ได้มีวัตถุประสงค์เพื่อก่อให้เกิดกิจกรรมทางการเงิน, การลงทุน, การซื้อขาย, ข้อเสนอแนะ หรือคำแนะนำประเภทอื่น ๆ ที่ให้หรือรับรองโดย TradingView อ่านเพิ่มเติมใน ข้อกำหนดการใช้งาน