
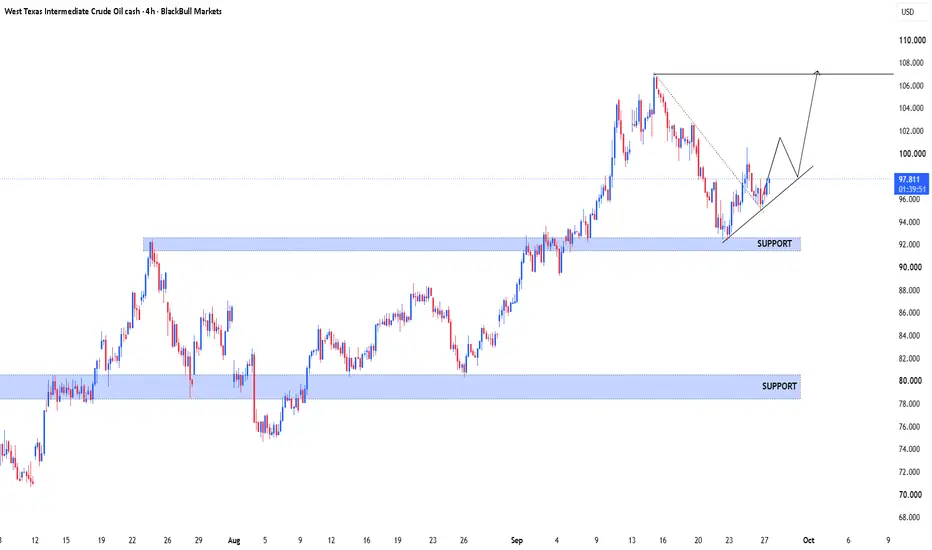
WTI crude oil is maintaining a broader bullish structure on the 4H chart, with price recently pulling back from the 106–107 area and finding support near the 92–93 region.
🔹 Major Support: The 92.0–93.0 zone has acted as an important structural area and is currently supporting the latest recovery.
🔹 Trendline: Price is respecting a rising trendline from the recent low, keeping the short-term structure constructive while it remains intact.
🔹 Current Price Action: WTI is trading around 97.6, with price attempting to build above the rising trendline after the reaction from support.
🔹 Upside Reference: The previous swing-high area around 106–107 remains the major resistance/liquidity reference visible on the chart.
🔹 Secondary Support: If the 92–93 area fails, the broader 78–81 support zone becomes the next major structural reference.
🔎 Structure Scenarios
Bullish scenario:
A sustained move above the recent local highs could indicate continuation toward the previous 106–107 resistance area.
Bearish scenario:
A decisive break below the rising trendline followed by weakness around 92–93 could signal a deeper correction toward lower support.
📌 Key concept: Higher-timeframe support + rising trendline + market structure.
This is an educational technical-analysis study based on the chart shown. It is not financial advice or a trade recommendation. Market conditions can change, so confirmation and independent risk management remain important.
#WTI #CrudeOil #USOIL #PriceAction #MarketStructure #TechnicalAnalysis #SupportResistance #TradingEducation
🔹 Major Support: The 92.0–93.0 zone has acted as an important structural area and is currently supporting the latest recovery.
🔹 Trendline: Price is respecting a rising trendline from the recent low, keeping the short-term structure constructive while it remains intact.
🔹 Current Price Action: WTI is trading around 97.6, with price attempting to build above the rising trendline after the reaction from support.
🔹 Upside Reference: The previous swing-high area around 106–107 remains the major resistance/liquidity reference visible on the chart.
🔹 Secondary Support: If the 92–93 area fails, the broader 78–81 support zone becomes the next major structural reference.
🔎 Structure Scenarios
Bullish scenario:
A sustained move above the recent local highs could indicate continuation toward the previous 106–107 resistance area.
Bearish scenario:
A decisive break below the rising trendline followed by weakness around 92–93 could signal a deeper correction toward lower support.
📌 Key concept: Higher-timeframe support + rising trendline + market structure.
This is an educational technical-analysis study based on the chart shown. It is not financial advice or a trade recommendation. Market conditions can change, so confirmation and independent risk management remain important.
#WTI #CrudeOil #USOIL #PriceAction #MarketStructure #TechnicalAnalysis #SupportResistance #TradingEducation

Join our Telegram channel for Forex & Gold education, market analysis, and free trading updates: t.me/+viwHvBPrtxwxZmE0
Join our Telegram channel for 3–5 daily Gold signals and professional market.
t.me/+viwHvBPrtxwxZmE0
Join our Telegram channel for 3–5 daily Gold signals and professional market.
t.me/+viwHvBPrtxwxZmE0
คำจำกัดสิทธิ์ความรับผิดชอบ
ข้อมูลและบทความไม่ได้มีวัตถุประสงค์เพื่อก่อให้เกิดกิจกรรมทางการเงิน, การลงทุน, การซื้อขาย, ข้อเสนอแนะ หรือคำแนะนำประเภทอื่น ๆ ที่ให้หรือรับรองโดย TradingView อ่านเพิ่มเติมใน ข้อกำหนดการใช้งาน
Join our Telegram channel for Forex & Gold education, market analysis, and free trading updates: t.me/+viwHvBPrtxwxZmE0
Join our Telegram channel for 3–5 daily Gold signals and professional market.
t.me/+viwHvBPrtxwxZmE0
Join our Telegram channel for 3–5 daily Gold signals and professional market.
t.me/+viwHvBPrtxwxZmE0
คำจำกัดสิทธิ์ความรับผิดชอบ
ข้อมูลและบทความไม่ได้มีวัตถุประสงค์เพื่อก่อให้เกิดกิจกรรมทางการเงิน, การลงทุน, การซื้อขาย, ข้อเสนอแนะ หรือคำแนะนำประเภทอื่น ๆ ที่ให้หรือรับรองโดย TradingView อ่านเพิ่มเติมใน ข้อกำหนดการใช้งาน