
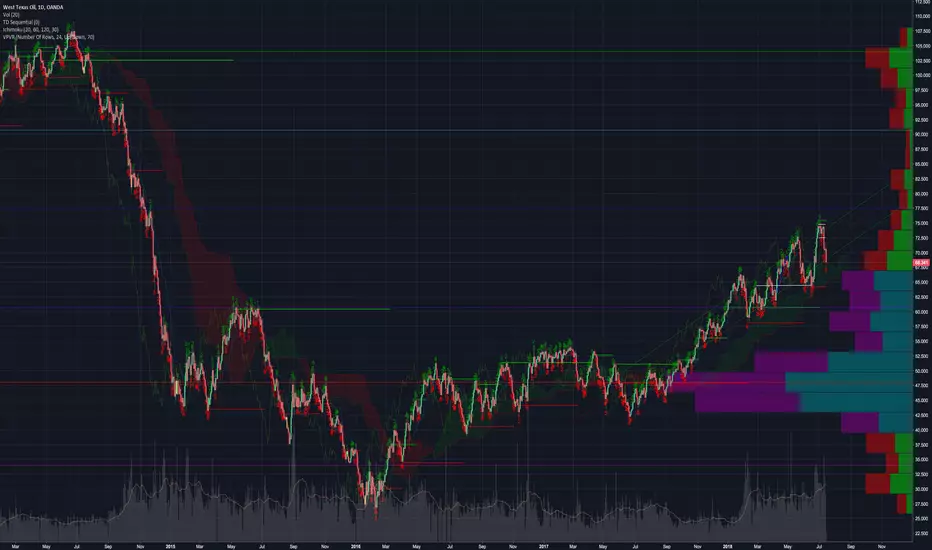
Yesterday’s analysis: Support Cluster from Ichimoku Cloud, Bollinger Band, and trendline. Visible range > monthly 9. Just noticed that a monthly 9 preceded the last bubble.
Patterns: Pitchfork
Horizontal support and resistance: S: $67.10 R: $69.28
12 & 26 EMA’s (calculate % difference): 12: -4.41% 26: -3.21%
MA crossovers: Bearish cross on 1h preceded sell off. Recent bullish cross on the weekly.
FIB’s: 0.381 at $77.28 | 0.236 at $60.72 | 0.5 at $90.67
Candlestick analysis: Waiting for consolidation
Ichimoku Cloud: D: fully bullish, expecting cloud to act as support at $68 W: Tenkan at $67.68 and starting to develop a c clamp
TD' Sequential: 3d has called the last two tops. Shows major support at $66.13 and resistance at $72.37. Red 8 on the daily tells me to get fully positioned before tomorrow’s close. Currently bouncing off red 9 on the 1 hour. If we break back above $69.50 then it will be time to seriously consider entering.
Visible Range: Good support at this level with very little built up resistance until $90.
50 & 200 MA’s (calculate % difference): 50: -1.65% 200: +8.22% 50 just started to angle downward. 50 period MA on 3d chart has been a final line of support for the bulls.
Bollinger Bands: 1W: MA at $67.55. Bottom band lines up with 50 week MA very nicely. 3D: just cross MA to the downside. 1D: Wider than we have seen it in years. Bottom band is angling sharply upward.
Trendline: Bottom end up bull trend at $66.23
Daily Trend: Bearish since 7/5
Fractals: DOWN = $63.6 UP = $74.75
Volume: Lowest volume we have seen since 11/23/2017
“As for me, I have no desire to carry the football from end zone to end zone. Just give me the territory between the 20 yard lines.” peterbrandt
Yard line of trend:
Start: $42
Target: $90
Field Lenge: $52
Current Price: $68.35
Yardline: 50
Conclusion: Volume has sharply decreased since 7/12 as price has pulled back. This indicates a dwindling amount of supply at these price levels. Visible range volume profile shows very little resistance between current price levels and $90. Recent bullish cross on weekly is a very good confirmation that this trend has room to go.
There will be a support cluster from $67 - $69 due to: trendline, kumo support from daily Ichimoku Cloud, Visible Range Volume Profile, prior horizontal resistance turning into support. Bottom band of the daily BB, and the MA from the weekly BB.
Red 8 on the daily TD' Sequential tells me to get fully positioned before tomorrow's close. Order currently set at $67.51. If price does not get there then I will be buying the next consolidation.
Patterns: Pitchfork
Horizontal support and resistance: S: $67.10 R: $69.28
12 & 26 EMA’s (calculate % difference): 12: -4.41% 26: -3.21%
MA crossovers: Bearish cross on 1h preceded sell off. Recent bullish cross on the weekly.
FIB’s: 0.381 at $77.28 | 0.236 at $60.72 | 0.5 at $90.67
Candlestick analysis: Waiting for consolidation
Ichimoku Cloud: D: fully bullish, expecting cloud to act as support at $68 W: Tenkan at $67.68 and starting to develop a c clamp
TD' Sequential: 3d has called the last two tops. Shows major support at $66.13 and resistance at $72.37. Red 8 on the daily tells me to get fully positioned before tomorrow’s close. Currently bouncing off red 9 on the 1 hour. If we break back above $69.50 then it will be time to seriously consider entering.
Visible Range: Good support at this level with very little built up resistance until $90.
50 & 200 MA’s (calculate % difference): 50: -1.65% 200: +8.22% 50 just started to angle downward. 50 period MA on 3d chart has been a final line of support for the bulls.
Bollinger Bands: 1W: MA at $67.55. Bottom band lines up with 50 week MA very nicely. 3D: just cross MA to the downside. 1D: Wider than we have seen it in years. Bottom band is angling sharply upward.
Trendline: Bottom end up bull trend at $66.23
Daily Trend: Bearish since 7/5
Fractals: DOWN = $63.6 UP = $74.75
Volume: Lowest volume we have seen since 11/23/2017
“As for me, I have no desire to carry the football from end zone to end zone. Just give me the territory between the 20 yard lines.” peterbrandt
Yard line of trend:
Start: $42
Target: $90
Field Lenge: $52
Current Price: $68.35
Yardline: 50
Conclusion: Volume has sharply decreased since 7/12 as price has pulled back. This indicates a dwindling amount of supply at these price levels. Visible range volume profile shows very little resistance between current price levels and $90. Recent bullish cross on weekly is a very good confirmation that this trend has room to go.
There will be a support cluster from $67 - $69 due to: trendline, kumo support from daily Ichimoku Cloud, Visible Range Volume Profile, prior horizontal resistance turning into support. Bottom band of the daily BB, and the MA from the weekly BB.
Red 8 on the daily TD' Sequential tells me to get fully positioned before tomorrow's close. Order currently set at $67.51. If price does not get there then I will be buying the next consolidation.
บันทึก
Yesterday’s analysis: Confluence of support, declining volume and 9 on the daily TD’ SequentialPatterns: Pitchfork
Horizontal support and resistance: S: $67.25 R: $68.62
9 & 21 EMA’s (calculate % difference): 9& 21: -3.52% currently making bearish cross
MA crossovers: Bullish. 50 just started to angle downward
FIB’s: 0.236 at $60.72 | 0.382 at $77.28 | 0.5 at $90.67
Candlestick analysis: Daily doji at support cluster
Ichimoku Cloud: Top of daily cloud acting as support. Tenkan is started to separate from the Kijun
TD Sequential: Red 9 on the daily is completing the buy setup. Red 7 on the countdown. Red 1 on the weekly. Green 2 on the monthly.
Visible Range: Clear skies until $90
50 & 200 MA’s (calculate % difference): 50: -2.18% 200: +7.64%
Bollinger Bands: Very wide on the daily. Bottom band part of support cluster. MA on weekly is apart of the support cluster.
Trendline: At trend support
Daily Trend: Bearish since 7/5
Fractals: DOWN: $63.63 UP: $74.73
On Balance Volume: Bull div on daily. Has not pulled back like the price would suggest.
Conclusion: Same as yesterday. 1st order got filled at $67.50. Still have 60% waiting to enter. Want to see reversal candles at support cluster and/or a green 2 above a green 1 on the daily.

emasar Indicator is available for purchase at alphanalysis.io/product/emasar/
คำจำกัดสิทธิ์ความรับผิดชอบ
ข้อมูลและบทความไม่ได้มีวัตถุประสงค์เพื่อก่อให้เกิดกิจกรรมทางการเงิน, การลงทุน, การซื้อขาย, ข้อเสนอแนะ หรือคำแนะนำประเภทอื่น ๆ ที่ให้หรือรับรองโดย TradingView อ่านเพิ่มเติมใน ข้อกำหนดการใช้งาน
emasar Indicator is available for purchase at alphanalysis.io/product/emasar/
คำจำกัดสิทธิ์ความรับผิดชอบ
ข้อมูลและบทความไม่ได้มีวัตถุประสงค์เพื่อก่อให้เกิดกิจกรรมทางการเงิน, การลงทุน, การซื้อขาย, ข้อเสนอแนะ หรือคำแนะนำประเภทอื่น ๆ ที่ให้หรือรับรองโดย TradingView อ่านเพิ่มเติมใน ข้อกำหนดการใช้งาน