
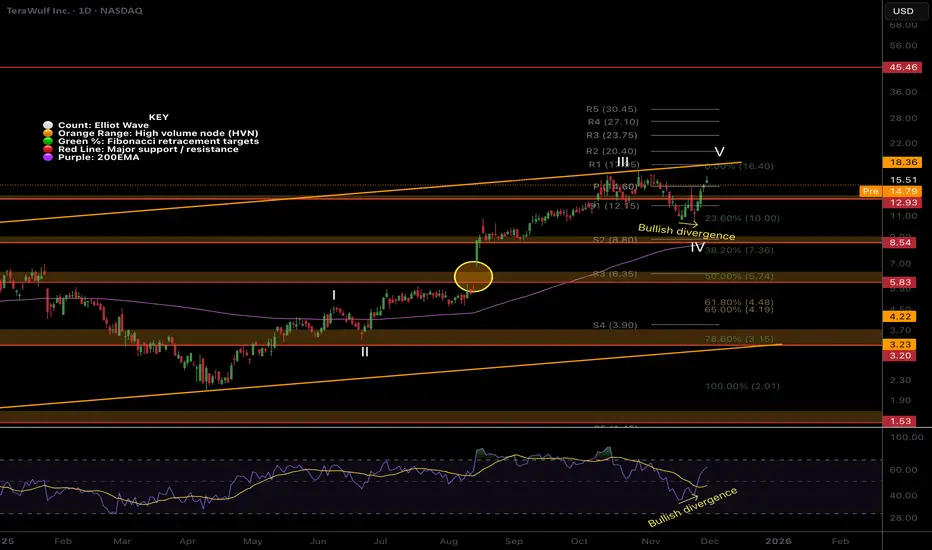
Price caught a bid above the daily 200EMA on bullish divergence. It’s possible a triangle is forming for wave IV.
Price is stuck between the breakout upper-boundary and mean support, its hard to decipher the next direction as it stands. A breakout above the line could see it rally to $25 while back below wave IV would test the 200EMA.
📈 Daily RSI had confirmed bullish divergence but not from oversold
👉 Continued upside will invalidate this analysis.
Safe trading
Price is stuck between the breakout upper-boundary and mean support, its hard to decipher the next direction as it stands. A breakout above the line could see it rally to $25 while back below wave IV would test the 200EMA.
📈 Daily RSI had confirmed bullish divergence but not from oversold
👉 Continued upside will invalidate this analysis.
Safe trading

การนำเสนอที่เกี่ยวข้อง
คำจำกัดสิทธิ์ความรับผิดชอบ
ข้อมูลและบทความไม่ได้มีวัตถุประสงค์เพื่อก่อให้เกิดกิจกรรมทางการเงิน, การลงทุน, การซื้อขาย, ข้อเสนอแนะ หรือคำแนะนำประเภทอื่น ๆ ที่ให้หรือรับรองโดย TradingView อ่านเพิ่มเติมใน ข้อกำหนดการใช้งาน
การนำเสนอที่เกี่ยวข้อง
คำจำกัดสิทธิ์ความรับผิดชอบ
ข้อมูลและบทความไม่ได้มีวัตถุประสงค์เพื่อก่อให้เกิดกิจกรรมทางการเงิน, การลงทุน, การซื้อขาย, ข้อเสนอแนะ หรือคำแนะนำประเภทอื่น ๆ ที่ให้หรือรับรองโดย TradingView อ่านเพิ่มเติมใน ข้อกำหนดการใช้งาน