
Hi Guys 👋
Lets look at the Silver Chart 👀
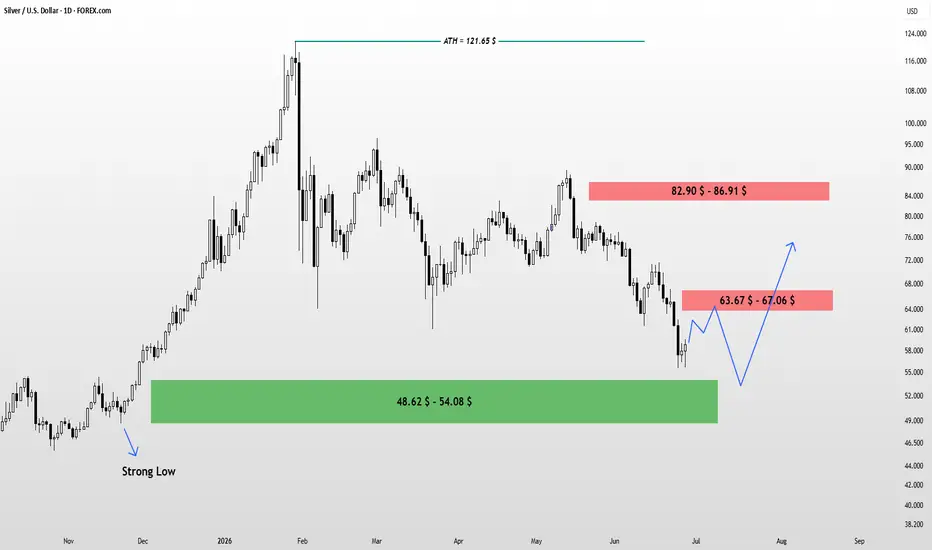
📌 By analyzing the silver chart on the daily timeframe, a clear downtrend can be observed, which began after the formation of an all-time high around the $121 level for this precious metal. The relatively strong bearish momentum, along with the formation of consecutive lower lows, confirms the strength of this downtrend.
📌 A significant bullish base can be identified in the $48–$54 range. This base has the potential to hold price and generate a bullish reaction over the longer term.
📌 In addition, two key supply zones are marked as illustrated, where bearish reactions from price are expected.
📌 Ultimately, these supply zones are not expected to break the major demand zone and the strong base. Instead, price is likely to move within a gradual, upward-sloping range over time.
⚠️ All published content reflects the analyst’s opinion only and does not constitute any financial or investment advice.
Feel Free to share your thought and comments on this post 😊
Sincerely,
Hossein Poursaei
Lets look at the Silver Chart 👀
📌 By analyzing the silver chart on the daily timeframe, a clear downtrend can be observed, which began after the formation of an all-time high around the $121 level for this precious metal. The relatively strong bearish momentum, along with the formation of consecutive lower lows, confirms the strength of this downtrend.
📌 A significant bullish base can be identified in the $48–$54 range. This base has the potential to hold price and generate a bullish reaction over the longer term.
📌 In addition, two key supply zones are marked as illustrated, where bearish reactions from price are expected.
📌 Ultimately, these supply zones are not expected to break the major demand zone and the strong base. Instead, price is likely to move within a gradual, upward-sloping range over time.
⚠️ All published content reflects the analyst’s opinion only and does not constitute any financial or investment advice.
Feel Free to share your thought and comments on this post 😊
Sincerely,
Hossein Poursaei

คำจำกัดสิทธิ์ความรับผิดชอบ
ข้อมูลและบทความไม่ได้มีวัตถุประสงค์เพื่อก่อให้เกิดกิจกรรมทางการเงิน, การลงทุน, การซื้อขาย, ข้อเสนอแนะ หรือคำแนะนำประเภทอื่น ๆ ที่ให้หรือรับรองโดย TradingView อ่านเพิ่มเติมใน ข้อกำหนดการใช้งาน
คำจำกัดสิทธิ์ความรับผิดชอบ
ข้อมูลและบทความไม่ได้มีวัตถุประสงค์เพื่อก่อให้เกิดกิจกรรมทางการเงิน, การลงทุน, การซื้อขาย, ข้อเสนอแนะ หรือคำแนะนำประเภทอื่น ๆ ที่ให้หรือรับรองโดย TradingView อ่านเพิ่มเติมใน ข้อกำหนดการใช้งาน