
Gold (XAUUSD) Technical Analysis for April 15th - Tuesday
Bias: Bounce Phase / Recovery within Broader Downtrend
CMP: 4,841.30 (as on 14 Apr 2026)
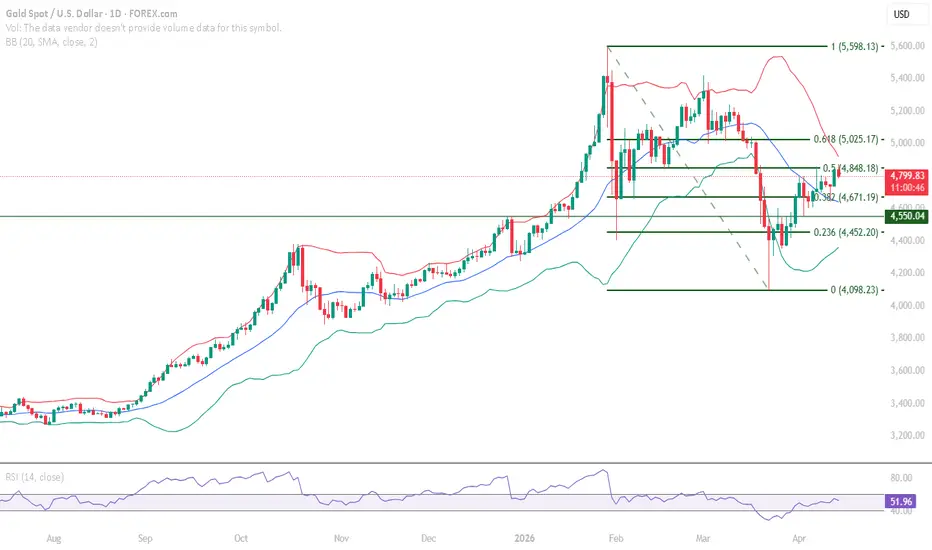
Gold recovered from a well-defined confluence support zone and has since advanced directionally to approach the Fibonacci 0.50 resistance level. Yesterday's session probed that resistance intraday but closed just below it. The structure now has a clear focal point.
Price Structure
Following the rally from the Fibonacci base, Gold pulled back into a key support zone where the Fibonacci 0.382 and Mid Bollinger Band converge. That zone held, and the recovery from it has been steady and directional rather than a sharp spike. Early signs of a higher high / higher low formation are developing, with accumulation behavior visible at the lower levels. Price advanced from that support cluster and is now testing the Fibonacci 0.50 resistance — an intraday probe reached close to that level yesterday, but the daily close came in just below it.
Indicator Signals
RSI is at 54.35 on the daily chart, well above the 40 level. The improvement from below 40 during the pullback phase to the current reading reflects a meaningful momentum shift aligned with the price recovery. RSI 40 remains the key reference on any pullback — sustaining above it keeps the recovery structure intact. Volume data is unavailable for this symbol from the chart data provider; RSI and Bollinger Band signals form the primary indicator framework.
Critical Zones
Resistance: 4,848.18 (Fibonacci 0.50, immediate) / 5,025.17 (Fibonacci 0.618)
Support: 4,671.19 (Fibonacci 0.382) / 4,650.56 (Mid Bollinger Band) / 4,550.04 (Major) / 4,452.20 (Fibonacci 0.236)
Broader Context
The structure remains a Bounce Phase within a broader corrective context from the January 2026 highs. Medium-term, consolidation with buying pressure at lower levels is intact. The long-term base provides the broader structural foundation. How Gold responds at the Fibonacci 0.50 on a closing basis will determine whether the structure extends toward the next Fibonacci level or returns to retest the support cluster below.
Yesterday's session probed the Fibonacci 0.50 intraday but closed just below it. In your analysis, how much weight do you place on an intraday test vs. a confirmed daily close when reading a key Fibonacci level — do you treat the intraday behavior as a signal on its own, or is the close the only confirmation that counts?
XAUUSD, Gold, GoldAnalysis, PreciousMetals, TechnicalAnalysis, ChartAnalysis, MarketStructure, Fibonacci
This analysis is educational technical chart analysis provided for informational purposes only. It does not constitute investment advice or any recommendation to buy, sell, or hold any financial instrument. All analysis is based on publicly available market data and is subject to change. Users are solely responsible for their own investment and trading decisions.
Bias: Bounce Phase / Recovery within Broader Downtrend
CMP: 4,841.30 (as on 14 Apr 2026)
Gold recovered from a well-defined confluence support zone and has since advanced directionally to approach the Fibonacci 0.50 resistance level. Yesterday's session probed that resistance intraday but closed just below it. The structure now has a clear focal point.
Price Structure
Following the rally from the Fibonacci base, Gold pulled back into a key support zone where the Fibonacci 0.382 and Mid Bollinger Band converge. That zone held, and the recovery from it has been steady and directional rather than a sharp spike. Early signs of a higher high / higher low formation are developing, with accumulation behavior visible at the lower levels. Price advanced from that support cluster and is now testing the Fibonacci 0.50 resistance — an intraday probe reached close to that level yesterday, but the daily close came in just below it.
Indicator Signals
RSI is at 54.35 on the daily chart, well above the 40 level. The improvement from below 40 during the pullback phase to the current reading reflects a meaningful momentum shift aligned with the price recovery. RSI 40 remains the key reference on any pullback — sustaining above it keeps the recovery structure intact. Volume data is unavailable for this symbol from the chart data provider; RSI and Bollinger Band signals form the primary indicator framework.
Critical Zones
Resistance: 4,848.18 (Fibonacci 0.50, immediate) / 5,025.17 (Fibonacci 0.618)
Support: 4,671.19 (Fibonacci 0.382) / 4,650.56 (Mid Bollinger Band) / 4,550.04 (Major) / 4,452.20 (Fibonacci 0.236)
Broader Context
The structure remains a Bounce Phase within a broader corrective context from the January 2026 highs. Medium-term, consolidation with buying pressure at lower levels is intact. The long-term base provides the broader structural foundation. How Gold responds at the Fibonacci 0.50 on a closing basis will determine whether the structure extends toward the next Fibonacci level or returns to retest the support cluster below.
Yesterday's session probed the Fibonacci 0.50 intraday but closed just below it. In your analysis, how much weight do you place on an intraday test vs. a confirmed daily close when reading a key Fibonacci level — do you treat the intraday behavior as a signal on its own, or is the close the only confirmation that counts?
XAUUSD, Gold, GoldAnalysis, PreciousMetals, TechnicalAnalysis, ChartAnalysis, MarketStructure, Fibonacci
This analysis is educational technical chart analysis provided for informational purposes only. It does not constitute investment advice or any recommendation to buy, sell, or hold any financial instrument. All analysis is based on publicly available market data and is subject to change. Users are solely responsible for their own investment and trading decisions.

คำจำกัดสิทธิ์ความรับผิดชอบ
ข้อมูลและบทความไม่ได้มีวัตถุประสงค์เพื่อก่อให้เกิดกิจกรรมทางการเงิน, การลงทุน, การซื้อขาย, ข้อเสนอแนะ หรือคำแนะนำประเภทอื่น ๆ ที่ให้หรือรับรองโดย TradingView อ่านเพิ่มเติมใน ข้อกำหนดการใช้งาน
คำจำกัดสิทธิ์ความรับผิดชอบ
ข้อมูลและบทความไม่ได้มีวัตถุประสงค์เพื่อก่อให้เกิดกิจกรรมทางการเงิน, การลงทุน, การซื้อขาย, ข้อเสนอแนะ หรือคำแนะนำประเภทอื่น ๆ ที่ให้หรือรับรองโดย TradingView อ่านเพิ่มเติมใน ข้อกำหนดการใช้งาน