
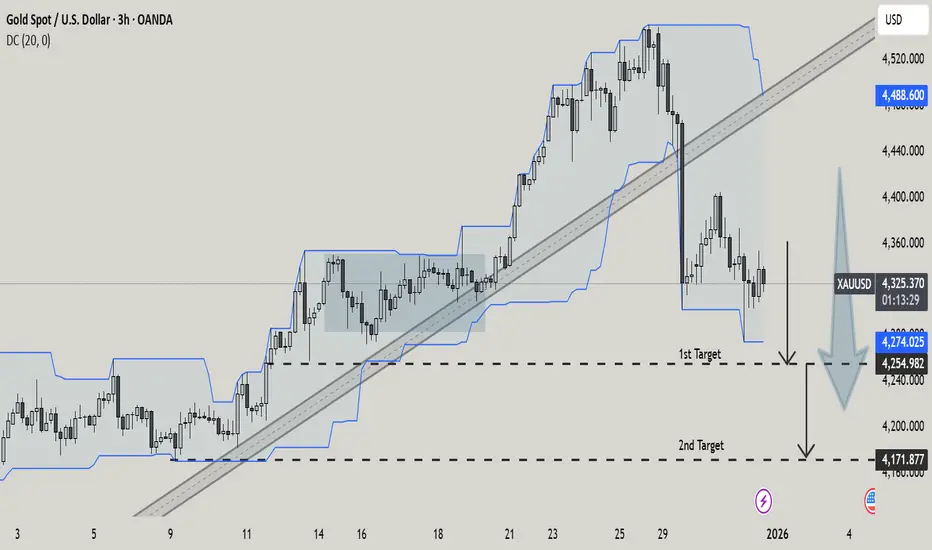
This is a 3-hour XAUUSD (Gold vs US Dollar) chart from TradingView showing a clear trend transition:
Strong bullish trend earlier, guided by a rising ascending channel.
Price respected the upper and lower channel boundaries while making higher highs.
A sharp bearish breakdown occurred, with price decisively falling below the trend channel — signaling a potential trend reversal.
After the breakdown, price attempted a weak pullback but failed to reclaim the channel.
Two key downside targets are marked:
1st Target: ~4,255
2nd Target: ~4,170
The blue dynamic bands (volatility / Donchian-style channel) show expansion followed by contraction, supporting increased downside momentum.
The projected arrows suggest continued bearish pressure into early 2026 if support levels fail.
Overall, the chart highlights a shift from bullish structure to bearish continuation, with clearly defined downside objectives.
Strong bullish trend earlier, guided by a rising ascending channel.
Price respected the upper and lower channel boundaries while making higher highs.
A sharp bearish breakdown occurred, with price decisively falling below the trend channel — signaling a potential trend reversal.
After the breakdown, price attempted a weak pullback but failed to reclaim the channel.
Two key downside targets are marked:
1st Target: ~4,255
2nd Target: ~4,170
The blue dynamic bands (volatility / Donchian-style channel) show expansion followed by contraction, supporting increased downside momentum.
The projected arrows suggest continued bearish pressure into early 2026 if support levels fail.
Overall, the chart highlights a shift from bullish structure to bearish continuation, with clearly defined downside objectives.

คำจำกัดสิทธิ์ความรับผิดชอบ
ข้อมูลและบทความไม่ได้มีวัตถุประสงค์เพื่อก่อให้เกิดกิจกรรมทางการเงิน, การลงทุน, การซื้อขาย, ข้อเสนอแนะ หรือคำแนะนำประเภทอื่น ๆ ที่ให้หรือรับรองโดย TradingView อ่านเพิ่มเติมใน ข้อกำหนดการใช้งาน
คำจำกัดสิทธิ์ความรับผิดชอบ
ข้อมูลและบทความไม่ได้มีวัตถุประสงค์เพื่อก่อให้เกิดกิจกรรมทางการเงิน, การลงทุน, การซื้อขาย, ข้อเสนอแนะ หรือคำแนะนำประเภทอื่น ๆ ที่ให้หรือรับรองโดย TradingView อ่านเพิ่มเติมใน ข้อกำหนดการใช้งาน