
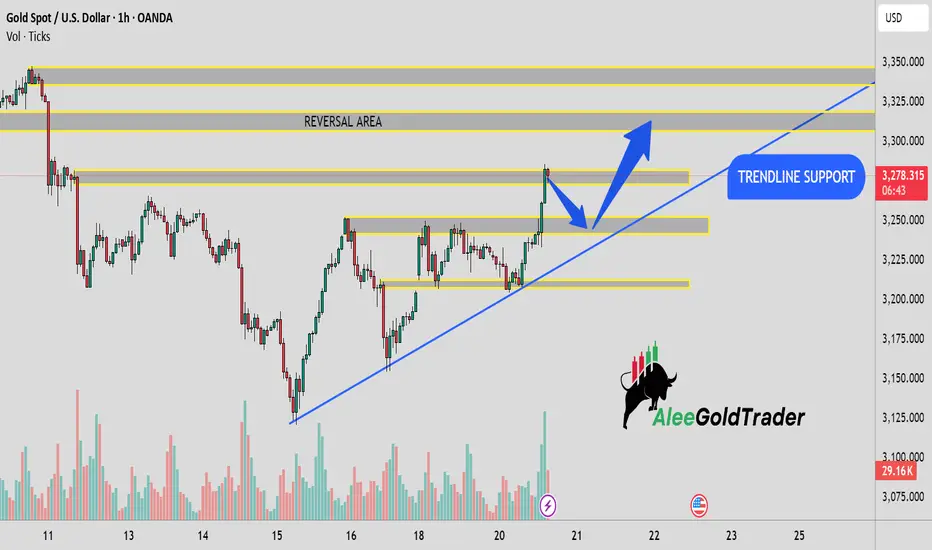
This 1-hour chart of Gold Spot (XAU/USD) shows a strong bullish trend supported by an ascending trendline. Price has recently broken above a key resistance level and is now approaching a marked Reversal Area. A pullback towards the highlighted trendline support and horizontal zone (~3,250) is anticipated before a potential continuation upwards. The chart suggests bullish momentum remains intact as long as the price holds above trendline support. Watch for price action confirmation near the support zone for potential long opportunities.
ปิดการเทรด: ถึงเป้าหมายการทำกำไร
ALHAMDULILLAH TARGET REACHED....
คำจำกัดสิทธิ์ความรับผิดชอบ
ข้อมูลและบทความไม่ได้มีวัตถุประสงค์เพื่อก่อให้เกิดกิจกรรมทางการเงิน, การลงทุน, การซื้อขาย, ข้อเสนอแนะ หรือคำแนะนำประเภทอื่น ๆ ที่ให้หรือรับรองโดย TradingView อ่านเพิ่มเติมใน ข้อกำหนดการใช้งาน
คำจำกัดสิทธิ์ความรับผิดชอบ
ข้อมูลและบทความไม่ได้มีวัตถุประสงค์เพื่อก่อให้เกิดกิจกรรมทางการเงิน, การลงทุน, การซื้อขาย, ข้อเสนอแนะ หรือคำแนะนำประเภทอื่น ๆ ที่ให้หรือรับรองโดย TradingView อ่านเพิ่มเติมใน ข้อกำหนดการใช้งาน