
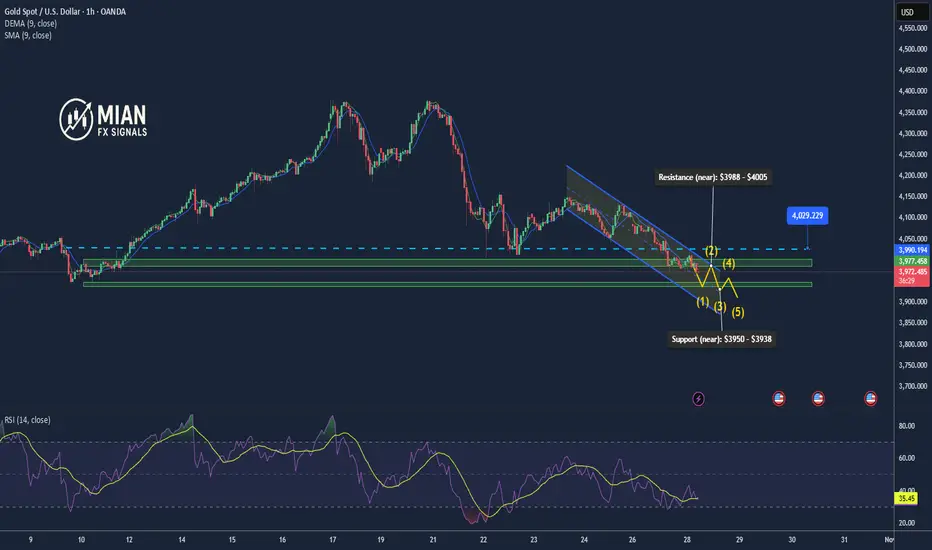
📊 Market Overview
Gold prices continued to drop sharply today, falling to around $3970/oz after breaking the key psychological level of $4000. Profit-taking pressure and a stronger USD weighed on the metal. Rising U.S. Treasury yields and expectations that the Federal Reserve may delay rate cuts further weakened investors’ appetite for gold.
🧭 Technical Analysis
• Trend: Strongly bearish; H1–H4 charts show an extended downward wave.
• Resistance (near): $3988 – $4005
• Resistance (upper): $4025 – $4040
• Support (near): $3950 – $3938
• EMA 50 & 200 (H1): EMA50 crossing below EMA200 confirms bearish bias.
• Candlestick pattern: Series of long-bodied bearish candles showing strong selling momentum.
• RSI (H1): 28 – oversold zone; possible short-term technical rebound.
💡 Outlook
Gold remains in a deep correction phase after several weeks of strong gains. The area between $3950–$3938 may trigger technical buying or short covering. If prices fail to break above $4005, the downtrend could extend toward $3920–$3900.
⚙️ 4. Trading Strategy
🔻 SELL XAU/USD : $4000 – $4003
🎯 TP: 40 / 80 / 200 pips
🛑 SL: $4007
🔺 BUY XAU/USD : $3938 – $3941
🎯 TP: 40 / 80 / 200 pips
🛑 SL: $3934
Gold prices continued to drop sharply today, falling to around $3970/oz after breaking the key psychological level of $4000. Profit-taking pressure and a stronger USD weighed on the metal. Rising U.S. Treasury yields and expectations that the Federal Reserve may delay rate cuts further weakened investors’ appetite for gold.
🧭 Technical Analysis
• Trend: Strongly bearish; H1–H4 charts show an extended downward wave.
• Resistance (near): $3988 – $4005
• Resistance (upper): $4025 – $4040
• Support (near): $3950 – $3938
• EMA 50 & 200 (H1): EMA50 crossing below EMA200 confirms bearish bias.
• Candlestick pattern: Series of long-bodied bearish candles showing strong selling momentum.
• RSI (H1): 28 – oversold zone; possible short-term technical rebound.
💡 Outlook
Gold remains in a deep correction phase after several weeks of strong gains. The area between $3950–$3938 may trigger technical buying or short covering. If prices fail to break above $4005, the downtrend could extend toward $3920–$3900.
⚙️ 4. Trading Strategy
🔻 SELL XAU/USD : $4000 – $4003
🎯 TP: 40 / 80 / 200 pips
🛑 SL: $4007
🔺 BUY XAU/USD : $3938 – $3941
🎯 TP: 40 / 80 / 200 pips
🛑 SL: $3934
การซื้อขายยังคงดำเนินอยู่
Gold is making a technical rebound; prefer to sell again around 3968 if a reversal signal appears.ปิดการเทรด: ถึงเป้าหมายการทำกำไร
Gold is testing the $3900 support; if it breaks below, the downtrend could extend toward $3870.
📊 Forex | Gold | Crypto Market Insights
📰 Real-time news updates & expert analysis
💡 Technical breakdowns & market outlooks
🔗 Join our free group: telegram.me/+DmS-dVFJMm40MDM9
📰 Real-time news updates & expert analysis
💡 Technical breakdowns & market outlooks
🔗 Join our free group: telegram.me/+DmS-dVFJMm40MDM9
การนำเสนอที่เกี่ยวข้อง
คำจำกัดสิทธิ์ความรับผิดชอบ
ข้อมูลและบทความไม่ได้มีวัตถุประสงค์เพื่อก่อให้เกิดกิจกรรมทางการเงิน, การลงทุน, การซื้อขาย, ข้อเสนอแนะ หรือคำแนะนำประเภทอื่น ๆ ที่ให้หรือรับรองโดย TradingView อ่านเพิ่มเติมใน ข้อกำหนดการใช้งาน
📊 Forex | Gold | Crypto Market Insights
📰 Real-time news updates & expert analysis
💡 Technical breakdowns & market outlooks
🔗 Join our free group: telegram.me/+DmS-dVFJMm40MDM9
📰 Real-time news updates & expert analysis
💡 Technical breakdowns & market outlooks
🔗 Join our free group: telegram.me/+DmS-dVFJMm40MDM9
การนำเสนอที่เกี่ยวข้อง
คำจำกัดสิทธิ์ความรับผิดชอบ
ข้อมูลและบทความไม่ได้มีวัตถุประสงค์เพื่อก่อให้เกิดกิจกรรมทางการเงิน, การลงทุน, การซื้อขาย, ข้อเสนอแนะ หรือคำแนะนำประเภทอื่น ๆ ที่ให้หรือรับรองโดย TradingView อ่านเพิ่มเติมใน ข้อกำหนดการใช้งาน