
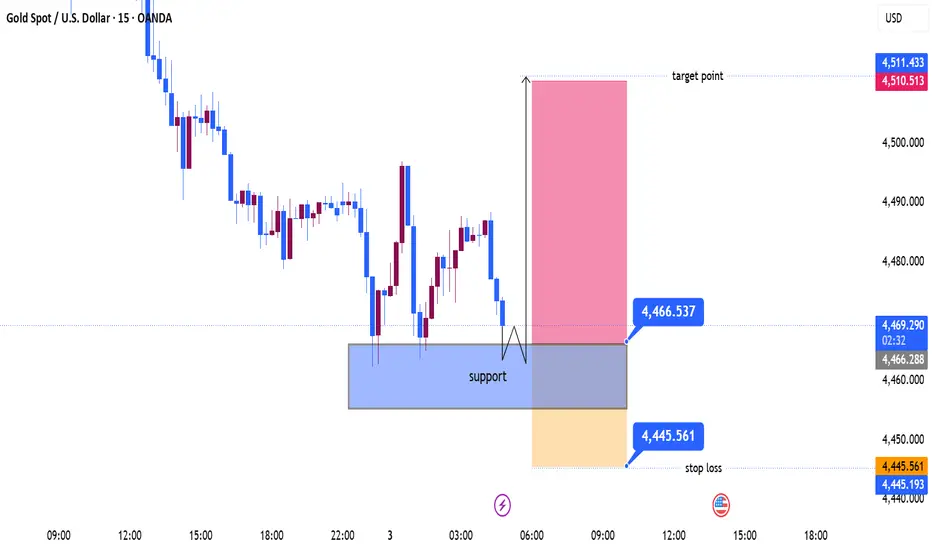
XAU/USD (Gold) – 15M Technical Analysis
Bias: Bullish Reversal from Support Zone
The chart shows price approaching a well-defined support area around 4456–4466, which has already attracted buyers multiple times. After the recent bearish move, gold is testing this demand zone again, creating the possibility of a bullish reaction.
Key Observations
Strong Support: 4456–4466 zone has acted as a demand area where previous declines were rejected.
Pullback Into Demand: Current bearish candles are retracing into support rather than breaking it decisively.
Potential Double-Bottom Formation: The marked structure suggests buyers may defend the zone and create a reversal pattern.
Risk-to-Reward Favorable: The illustrated setup offers a relatively small stop-loss compared to the projected upside target.
Trade Scenario
Buy Zone: 4456–4466
Stop Loss: 4445.5
Target: 4510–4511
If price forms bullish confirmation (bullish engulfing candle, rejection wick, or higher low) inside the support area, buyers could push gold toward the 4510 resistance region.
Invalidation
A sustained break and close below 4455 would weaken the bullish outlook and could trigger further downside pressure toward lower support levels.
Conclusion
The 15-minute structure favors a bullish rebound from support, provided buyers defend the 4456–4466 demand zone. Confirmation from price action is recommended before entry, with 4510 acting as the primary upside objective.
Bias: Bullish Reversal from Support Zone
The chart shows price approaching a well-defined support area around 4456–4466, which has already attracted buyers multiple times. After the recent bearish move, gold is testing this demand zone again, creating the possibility of a bullish reaction.
Key Observations
Strong Support: 4456–4466 zone has acted as a demand area where previous declines were rejected.
Pullback Into Demand: Current bearish candles are retracing into support rather than breaking it decisively.
Potential Double-Bottom Formation: The marked structure suggests buyers may defend the zone and create a reversal pattern.
Risk-to-Reward Favorable: The illustrated setup offers a relatively small stop-loss compared to the projected upside target.
Trade Scenario
Buy Zone: 4456–4466
Stop Loss: 4445.5
Target: 4510–4511
If price forms bullish confirmation (bullish engulfing candle, rejection wick, or higher low) inside the support area, buyers could push gold toward the 4510 resistance region.
Invalidation
A sustained break and close below 4455 would weaken the bullish outlook and could trigger further downside pressure toward lower support levels.
Conclusion
The 15-minute structure favors a bullish rebound from support, provided buyers defend the 4456–4466 demand zone. Confirmation from price action is recommended before entry, with 4510 acting as the primary upside objective.

join my telegram channel t.me/goldsignalicthttps://t.me/goldsignalicthttps://t.me/goldsignalict
คำจำกัดสิทธิ์ความรับผิดชอบ
ข้อมูลและบทความไม่ได้มีวัตถุประสงค์เพื่อก่อให้เกิดกิจกรรมทางการเงิน, การลงทุน, การซื้อขาย, ข้อเสนอแนะ หรือคำแนะนำประเภทอื่น ๆ ที่ให้หรือรับรองโดย TradingView อ่านเพิ่มเติมใน ข้อกำหนดการใช้งาน
join my telegram channel t.me/goldsignalicthttps://t.me/goldsignalicthttps://t.me/goldsignalict
คำจำกัดสิทธิ์ความรับผิดชอบ
ข้อมูลและบทความไม่ได้มีวัตถุประสงค์เพื่อก่อให้เกิดกิจกรรมทางการเงิน, การลงทุน, การซื้อขาย, ข้อเสนอแนะ หรือคำแนะนำประเภทอื่น ๆ ที่ให้หรือรับรองโดย TradingView อ่านเพิ่มเติมใน ข้อกำหนดการใช้งาน