Long
XAUUSD Setup: Key Levels to Watch Before the Next Big Swing
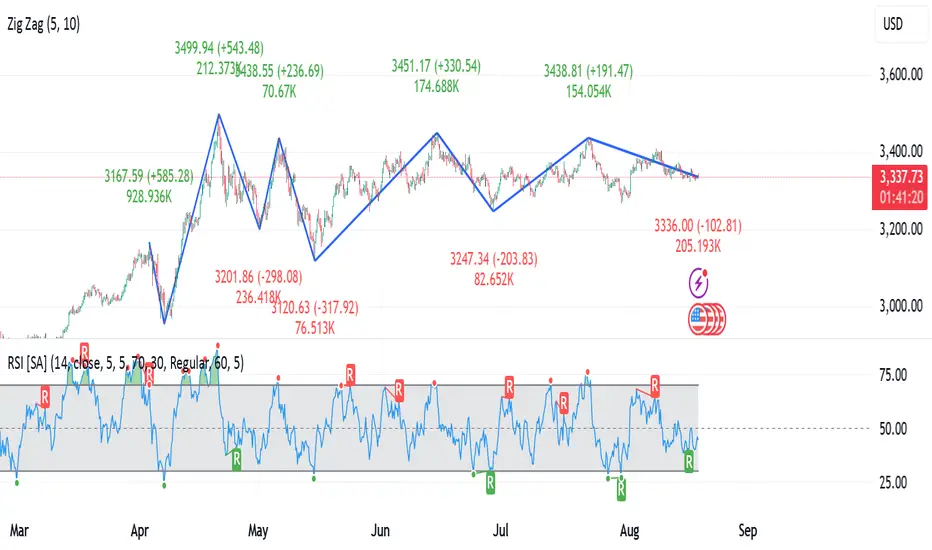
1. Chart Type & Indicators
Instrument: XAUUSD (Gold vs USD)
Timeframe: Likely Daily or 4H (based on structure)
Indicators:
Zig Zag (5, 10) – Helps visualize swing highs/lows and trend reversals.
RSI (14) with signals marked (R for Reversal points).
Price: 3,338.34 USD (at the time of the snapshot).
2. Trend Structure (Price Action)
Previous High: Around 3,500.
Current Price: 3,338, which is down ~4.6% from the recent high.
Key Swings:
Uptrend from 3,167 → 3,499 (+10.5%).
Correction down to 3,120 (-10.8%).
Subsequent swings are smaller, showing reduced volatility.
Observation:
Price is consolidating in a range between 3,250 and 3,450 after a strong rally.
ZigZag indicates lower highs and lower lows recently, signaling a mild downtrend.
3. RSI Analysis
Current RSI: 45.18 (Neutral zone, slightly bearish bias).
Overbought zone (70+) was tested multiple times in the past but failed to hold, causing corrections.
Recent green dot (R) indicates possible oversold bounce near 30 RSI in early August.
Observation:
RSI is not yet bullish, suggesting the price could range or test support before trending up.
4. Key Levels
Resistance Zones:
3,450 – 3,500 (major resistance from previous highs).
Support Zones:
3,300 – 3,250 (strong demand zone).
Below that, 3,120 acts as major support.
5. Volume
Higher volumes were observed during the strong rally (March-April).
The recent volume is lower, indicating a weakening trend strength.
6. Possible Scenarios
Bullish Scenario:
If the price breaks above 3,450 with strong momentum, it can retest 3,500 and potentially move beyond.
Bearish Scenario:
If the price falls below 3,300, we could see 3,250 and 3,120 next.
7. Trading Plan
Long Position: Only on breakout above 3,450 with volume confirmation (target 3,500–3,600).
Short Position: If price closes below 3,300 (target 3,250–3,120).
Range Trading: Between 3,300–3,450 (buy dips near 3,300, sell near 3,450).
Summary: Market is in sideways consolidation after a strong uptrend. RSI suggests neutral to slightly bearish. Watch for a breakout above 3,450 or a breakdown below 3,300.
Instrument: XAUUSD (Gold vs USD)
Timeframe: Likely Daily or 4H (based on structure)
Indicators:
Zig Zag (5, 10) – Helps visualize swing highs/lows and trend reversals.
RSI (14) with signals marked (R for Reversal points).
Price: 3,338.34 USD (at the time of the snapshot).
2. Trend Structure (Price Action)
Previous High: Around 3,500.
Current Price: 3,338, which is down ~4.6% from the recent high.
Key Swings:
Uptrend from 3,167 → 3,499 (+10.5%).
Correction down to 3,120 (-10.8%).
Subsequent swings are smaller, showing reduced volatility.
Observation:
Price is consolidating in a range between 3,250 and 3,450 after a strong rally.
ZigZag indicates lower highs and lower lows recently, signaling a mild downtrend.
3. RSI Analysis
Current RSI: 45.18 (Neutral zone, slightly bearish bias).
Overbought zone (70+) was tested multiple times in the past but failed to hold, causing corrections.
Recent green dot (R) indicates possible oversold bounce near 30 RSI in early August.
Observation:
RSI is not yet bullish, suggesting the price could range or test support before trending up.
4. Key Levels
Resistance Zones:
3,450 – 3,500 (major resistance from previous highs).
Support Zones:
3,300 – 3,250 (strong demand zone).
Below that, 3,120 acts as major support.
5. Volume
Higher volumes were observed during the strong rally (March-April).
The recent volume is lower, indicating a weakening trend strength.
6. Possible Scenarios
Bullish Scenario:
If the price breaks above 3,450 with strong momentum, it can retest 3,500 and potentially move beyond.
Bearish Scenario:
If the price falls below 3,300, we could see 3,250 and 3,120 next.
7. Trading Plan
Long Position: Only on breakout above 3,450 with volume confirmation (target 3,500–3,600).
Short Position: If price closes below 3,300 (target 3,250–3,120).
Range Trading: Between 3,300–3,450 (buy dips near 3,300, sell near 3,450).
Summary: Market is in sideways consolidation after a strong uptrend. RSI suggests neutral to slightly bearish. Watch for a breakout above 3,450 or a breakdown below 3,300.

คำจำกัดสิทธิ์ความรับผิดชอบ
ข้อมูลและบทความไม่ได้มีวัตถุประสงค์เพื่อก่อให้เกิดกิจกรรมทางการเงิน, การลงทุน, การซื้อขาย, ข้อเสนอแนะ หรือคำแนะนำประเภทอื่น ๆ ที่ให้หรือรับรองโดย TradingView อ่านเพิ่มเติมใน ข้อกำหนดการใช้งาน
คำจำกัดสิทธิ์ความรับผิดชอบ
ข้อมูลและบทความไม่ได้มีวัตถุประสงค์เพื่อก่อให้เกิดกิจกรรมทางการเงิน, การลงทุน, การซื้อขาย, ข้อเสนอแนะ หรือคำแนะนำประเภทอื่น ๆ ที่ให้หรือรับรองโดย TradingView อ่านเพิ่มเติมใน ข้อกำหนดการใช้งาน