
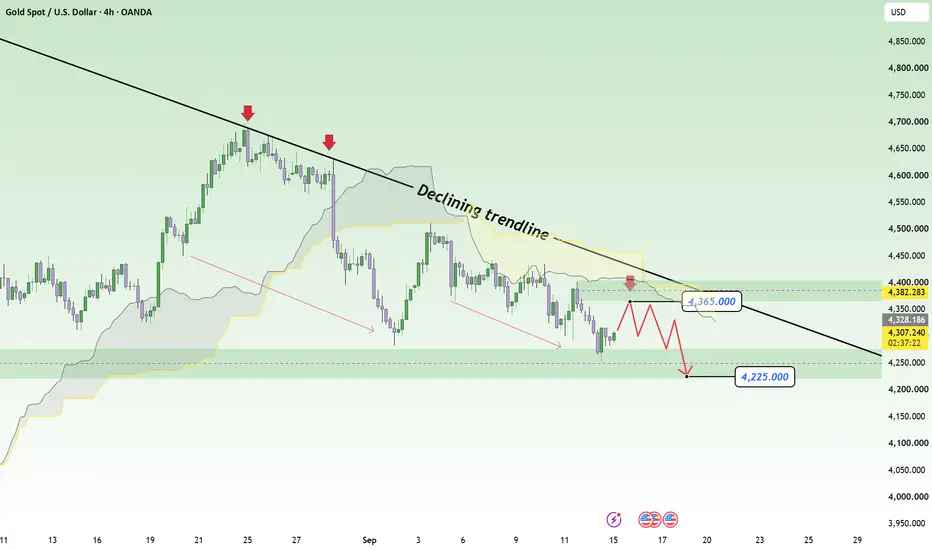
Hello traders, if we put short-term noise aside and look at XAUUSD in a disciplined and objective way, the current picture is sending a fairly clear message: the bearish trend has not been broken yet.
Looking at the broader backdrop, pressure on gold remains as hotter-than-expected U.S. inflation has increased expectations of a Fed rate hike, while U.S. Treasury yields continue to stay elevated. This keeps the interest-rate environment unfavorable for a non-yielding asset like gold. In other words, the current rebound still lacks the fundamental catalyst needed to signal the beginning of a new uptrend.
Moving to the H4 chart, the bearish structure remains quite clear:
Price continues to trade below the descending trendline, with a consistent sequence of lower highs.
The area around 4,365 is not random: the descending trendline and the Ichimoku zone converge here, creating an important defensive area for sellers.
Recent recovery attempts have lacked follow-through, suggesting that buyers have yet to regain meaningful control.
What stands out is this: every time gold approaches the resistance area above, selling pressure returns relatively quickly. When a market repeatedly fails to break resistance despite several recovery attempts, it often signals that sellers are still controlling the structure.
📌 Highest-probability scenario:
As long as XAUUSD remains below 4,365 and the descending trendline stays intact, I expect the current rebound to face renewed selling pressure, with my main target around 4,225. Only a decisive and sustained breakout above the bearish structure would make me reassess this scenario.
Looking at the broader backdrop, pressure on gold remains as hotter-than-expected U.S. inflation has increased expectations of a Fed rate hike, while U.S. Treasury yields continue to stay elevated. This keeps the interest-rate environment unfavorable for a non-yielding asset like gold. In other words, the current rebound still lacks the fundamental catalyst needed to signal the beginning of a new uptrend.
Moving to the H4 chart, the bearish structure remains quite clear:
Price continues to trade below the descending trendline, with a consistent sequence of lower highs.
The area around 4,365 is not random: the descending trendline and the Ichimoku zone converge here, creating an important defensive area for sellers.
Recent recovery attempts have lacked follow-through, suggesting that buyers have yet to regain meaningful control.
What stands out is this: every time gold approaches the resistance area above, selling pressure returns relatively quickly. When a market repeatedly fails to break resistance despite several recovery attempts, it often signals that sellers are still controlling the structure.
📌 Highest-probability scenario:
As long as XAUUSD remains below 4,365 and the descending trendline stays intact, I expect the current rebound to face renewed selling pressure, with my main target around 4,225. Only a decisive and sustained breakout above the bearish structure would make me reassess this scenario.
การซื้อขายยังคงดำเนินอยู่
ปิดการเทรด: ถึงเป้าหมายการทำกำไร

Want the full plan behind this analysis?
Free daily Forex, Gold, Crypto setups with reasoning
Entry, invalidation, targets and reviews
👉 Join free: t.me/+-HowPr1J4k03NGY1
Educational only. Not financial advice. Trading involves risk.
Free daily Forex, Gold, Crypto setups with reasoning
Entry, invalidation, targets and reviews
👉 Join free: t.me/+-HowPr1J4k03NGY1
Educational only. Not financial advice. Trading involves risk.
การนำเสนอที่เกี่ยวข้อง
คำจำกัดสิทธิ์ความรับผิดชอบ
ข้อมูลและบทความไม่ได้มีวัตถุประสงค์เพื่อก่อให้เกิดกิจกรรมทางการเงิน, การลงทุน, การซื้อขาย, ข้อเสนอแนะ หรือคำแนะนำประเภทอื่น ๆ ที่ให้หรือรับรองโดย TradingView อ่านเพิ่มเติมใน ข้อกำหนดการใช้งาน
Want the full plan behind this analysis?
Free daily Forex, Gold, Crypto setups with reasoning
Entry, invalidation, targets and reviews
👉 Join free: t.me/+-HowPr1J4k03NGY1
Educational only. Not financial advice. Trading involves risk.
Free daily Forex, Gold, Crypto setups with reasoning
Entry, invalidation, targets and reviews
👉 Join free: t.me/+-HowPr1J4k03NGY1
Educational only. Not financial advice. Trading involves risk.
การนำเสนอที่เกี่ยวข้อง
คำจำกัดสิทธิ์ความรับผิดชอบ
ข้อมูลและบทความไม่ได้มีวัตถุประสงค์เพื่อก่อให้เกิดกิจกรรมทางการเงิน, การลงทุน, การซื้อขาย, ข้อเสนอแนะ หรือคำแนะนำประเภทอื่น ๆ ที่ให้หรือรับรองโดย TradingView อ่านเพิ่มเติมใน ข้อกำหนดการใช้งาน