
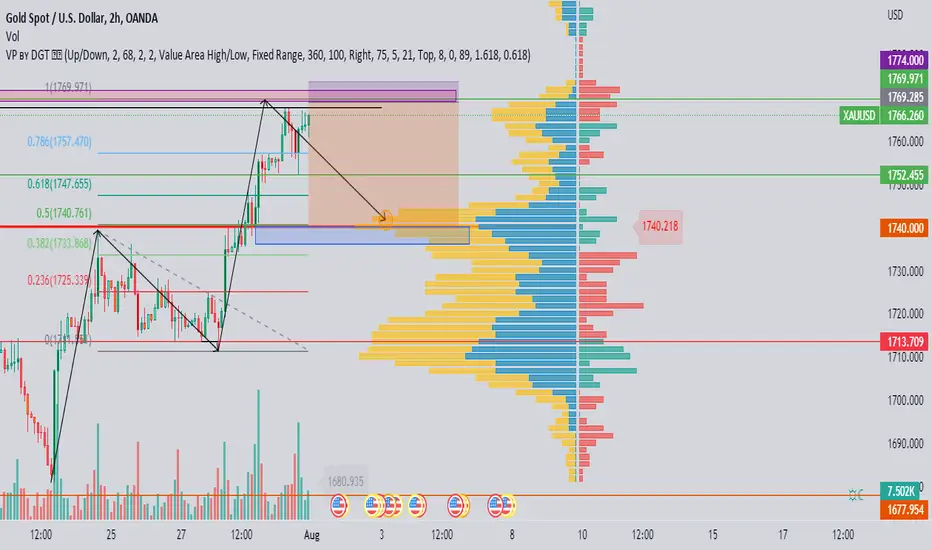
As we are seeing AB=CD in Gold on 2 hrs time frame (better on 4Hrs) .
by putting a trend base fib from the point A to point B and fib start from point C we can see the ressistance or the end of the point D i.e. 1769.971 we can clearly expect a short on the gold up to our demand zone 1740.320 - 1736.085.
we can also see the short trade supported by the fixed volme profile with the target of 1740.218.
My analysis summary
gold short 1769 - 1772
sl - 1773
tp - 1740
by putting a trend base fib from the point A to point B and fib start from point C we can see the ressistance or the end of the point D i.e. 1769.971 we can clearly expect a short on the gold up to our demand zone 1740.320 - 1736.085.
we can also see the short trade supported by the fixed volme profile with the target of 1740.218.
My analysis summary
gold short 1769 - 1772
sl - 1773
tp - 1740
บันทึก
please support me by liking the content so that i will be motivatedt to post more of these
การนำเสนอที่เกี่ยวข้อง
คำจำกัดสิทธิ์ความรับผิดชอบ
ข้อมูลและบทความไม่ได้มีวัตถุประสงค์เพื่อก่อให้เกิดกิจกรรมทางการเงิน, การลงทุน, การซื้อขาย, ข้อเสนอแนะ หรือคำแนะนำประเภทอื่น ๆ ที่ให้หรือรับรองโดย TradingView อ่านเพิ่มเติมใน ข้อกำหนดการใช้งาน
การนำเสนอที่เกี่ยวข้อง
คำจำกัดสิทธิ์ความรับผิดชอบ
ข้อมูลและบทความไม่ได้มีวัตถุประสงค์เพื่อก่อให้เกิดกิจกรรมทางการเงิน, การลงทุน, การซื้อขาย, ข้อเสนอแนะ หรือคำแนะนำประเภทอื่น ๆ ที่ให้หรือรับรองโดย TradingView อ่านเพิ่มเติมใน ข้อกำหนดการใช้งาน