
🐢 Gold's Potential Turtle Soup: Riding the CRT Wave?
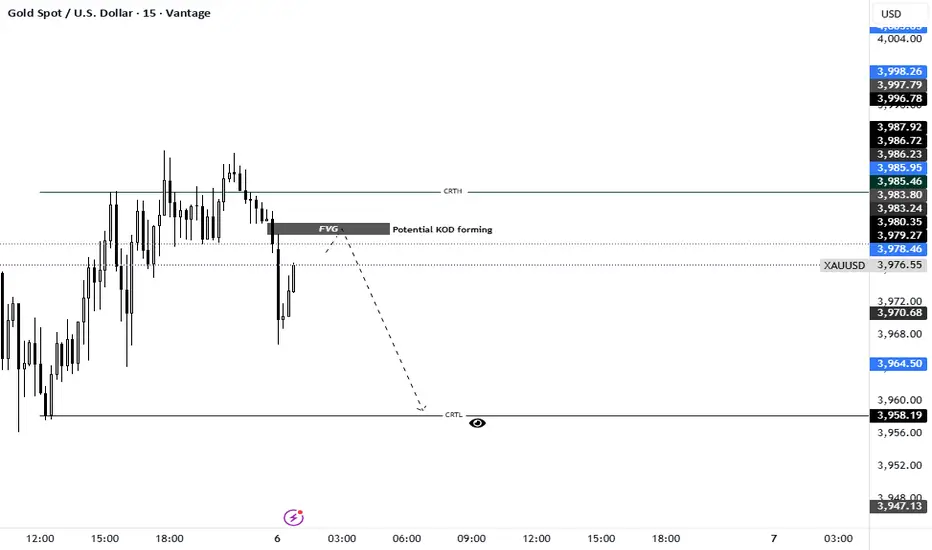
The chart for XAU/USD (Gold) is showing an intriguing setup on the 15-minute timeframe that combines several high-probability concepts.
🌊 The CRT Foundation
Consolidation (C): Price recently saw a strong move up into the CRTH (Consolidation Resistance/High) at approximately $3,983 - $3,987. This area represents a clear high of recent structure.
Retracement (R): We've seen a sharp retracement/sell-off after testing the high, creating a noticeable FVG (Fair Value Gap).
Trend (T): The overall context suggests an underlying bullish trend, meaning this retracement could be fuel for the next leg up.
🥣 The Turtle Soup Setup
The sharp drop has set the stage for a classic Turtle Soup scenario. This pattern typically occurs when a high or low is clearly broken, inducing retail traders to jump onto the perceived breakout, only for the price to quickly reverse.
The recent low at $3,958.19 (CRTL - Consolidation Low) is our target. If price drops to break this low, it will likely trap early shorts.
The "Potential KGD forming" (Kill Zone Draw) is strategically positioned to indicate where Smart Money might be looking to step in.
🎯 My Trade Thesis
I'm watching for a fake-out:
Slight break below the CRTL ($3,958.19) to trigger stop losses and attract shorts (Turtle Soup Entry).
A sharp reversal back above the CRTL, preferably reacting off a deeper liquidity zone.
Target: A move back up to fill the FVG and re-test the CRTH for a potential final push toward $4,000+.
Invalidation: A strong, decisive close well below the CRTL, indicating a genuine structural break.
Greetings,
MrYounity
The chart for XAU/USD (Gold) is showing an intriguing setup on the 15-minute timeframe that combines several high-probability concepts.
🌊 The CRT Foundation
Consolidation (C): Price recently saw a strong move up into the CRTH (Consolidation Resistance/High) at approximately $3,983 - $3,987. This area represents a clear high of recent structure.
Retracement (R): We've seen a sharp retracement/sell-off after testing the high, creating a noticeable FVG (Fair Value Gap).
Trend (T): The overall context suggests an underlying bullish trend, meaning this retracement could be fuel for the next leg up.
🥣 The Turtle Soup Setup
The sharp drop has set the stage for a classic Turtle Soup scenario. This pattern typically occurs when a high or low is clearly broken, inducing retail traders to jump onto the perceived breakout, only for the price to quickly reverse.
The recent low at $3,958.19 (CRTL - Consolidation Low) is our target. If price drops to break this low, it will likely trap early shorts.
The "Potential KGD forming" (Kill Zone Draw) is strategically positioned to indicate where Smart Money might be looking to step in.
🎯 My Trade Thesis
I'm watching for a fake-out:
Slight break below the CRTL ($3,958.19) to trigger stop losses and attract shorts (Turtle Soup Entry).
A sharp reversal back above the CRTL, preferably reacting off a deeper liquidity zone.
Target: A move back up to fill the FVG and re-test the CRTH for a potential final push toward $4,000+.
Invalidation: A strong, decisive close well below the CRTL, indicating a genuine structural break.
Greetings,
MrYounity

คำจำกัดสิทธิ์ความรับผิดชอบ
ข้อมูลและบทความไม่ได้มีวัตถุประสงค์เพื่อก่อให้เกิดกิจกรรมทางการเงิน, การลงทุน, การซื้อขาย, ข้อเสนอแนะ หรือคำแนะนำประเภทอื่น ๆ ที่ให้หรือรับรองโดย TradingView อ่านเพิ่มเติมใน ข้อกำหนดการใช้งาน
คำจำกัดสิทธิ์ความรับผิดชอบ
ข้อมูลและบทความไม่ได้มีวัตถุประสงค์เพื่อก่อให้เกิดกิจกรรมทางการเงิน, การลงทุน, การซื้อขาย, ข้อเสนอแนะ หรือคำแนะนำประเภทอื่น ๆ ที่ให้หรือรับรองโดย TradingView อ่านเพิ่มเติมใน ข้อกำหนดการใช้งาน