
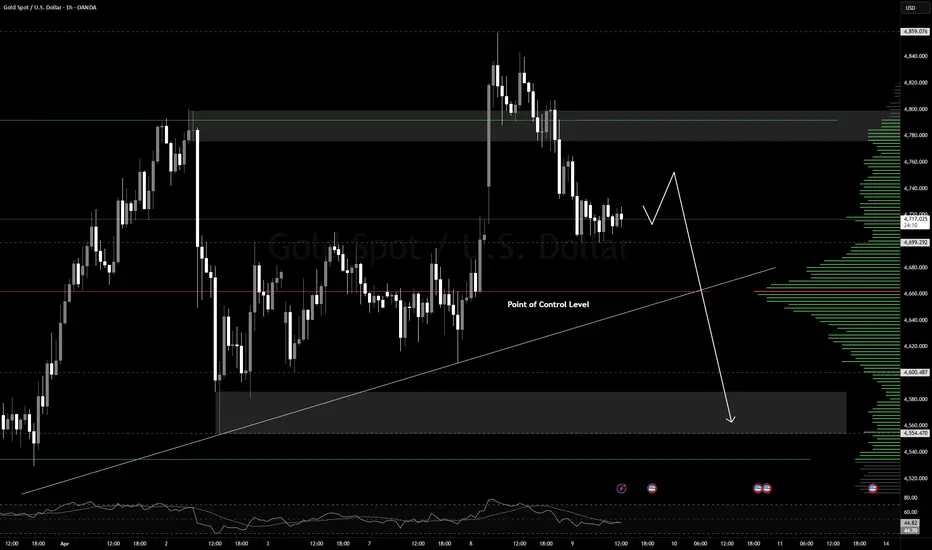
Gold prices (XAU/USD) demonstrated remarkable resilience, holding above the psychological $4,700 level during today's Asian session. Despite a correction from a three-week high, gold regained support amid market skepticism about the stability of the Middle East ceasefire and mixed monetary signals from the US.
------------------------------------------------------------------------------
⚔️ Geopolitics: Lebanon Escalation & Re-Closing of the Strait of Hormuz
Yesterday's ceasefire optimism began to fade drastically:
- ⚡Israeli Attack on Lebanon: Israel launched a massive airstrike against Hezbollah in Lebanon, asserting that it was not bound by the US-Iran ceasefire agreement. The White House confirmed that Lebanon was not a party to the pact.
- ⚡Iranian Response: Tehran reacted strongly by re-closing traffic in the Strait of Hormuz and threatening to cancel the two-week ceasefire if attacks on Lebanon continued.
- ⚡Market Impact: These renewed tensions revived demand for the US Dollar (USD) as a safe haven, technically limiting gold price gains.
🏦 Monetary: FOMC Minutes "Higher for Longer" vs. Dovish Signals
The minutes of the Fed meeting (March 17-18) sent a dual message to investors:
- ⚡Hawkish: Fed officials stated they were in no rush to cut interest rates due to the risk of energy inflation from the Middle East. They were prepared to keep interest rates high for a longer period.
- ⚡Dovish Signals: On the other hand, the Fed still projected one interest rate cut by the end of 2026. This signal prevented further USD strengthening from its one-month low, providing a breather for gold prices.
-------------------------------------------------------------------------------
🎯 Key Levels to Watch 🎯
- ⚡Immediate Resistance ($4,758): 50.0% Fibonacci Retracement Level. Prices need to break through this level simply to stabilize the short-term bias.
- ⚡Upper Psychological Target ($5,000): The main obstacle if a significant recovery occurs beyond the 200-day moving average (SMA).
- ⚡Critical Support 1 ($4,604): The 38.2% Fibonacci Retracement Level. A break below this level would confirm the failure of this week's recovery.
- ⚡Critical Support 2 ($4,412): The 23.6% Fibonacci Retracement Level. This area will be the next downside target if $4,600 fails to hold.
- ⚡Floor ($4,102): The previous swing low (March low). At this level, significant buying interest is expected to re-emerge.
------------------------------------------------------------------------------
⚔️ Geopolitics: Lebanon Escalation & Re-Closing of the Strait of Hormuz
Yesterday's ceasefire optimism began to fade drastically:
- ⚡Israeli Attack on Lebanon: Israel launched a massive airstrike against Hezbollah in Lebanon, asserting that it was not bound by the US-Iran ceasefire agreement. The White House confirmed that Lebanon was not a party to the pact.
- ⚡Iranian Response: Tehran reacted strongly by re-closing traffic in the Strait of Hormuz and threatening to cancel the two-week ceasefire if attacks on Lebanon continued.
- ⚡Market Impact: These renewed tensions revived demand for the US Dollar (USD) as a safe haven, technically limiting gold price gains.
🏦 Monetary: FOMC Minutes "Higher for Longer" vs. Dovish Signals
The minutes of the Fed meeting (March 17-18) sent a dual message to investors:
- ⚡Hawkish: Fed officials stated they were in no rush to cut interest rates due to the risk of energy inflation from the Middle East. They were prepared to keep interest rates high for a longer period.
- ⚡Dovish Signals: On the other hand, the Fed still projected one interest rate cut by the end of 2026. This signal prevented further USD strengthening from its one-month low, providing a breather for gold prices.
-------------------------------------------------------------------------------
🎯 Key Levels to Watch 🎯
- ⚡Immediate Resistance ($4,758): 50.0% Fibonacci Retracement Level. Prices need to break through this level simply to stabilize the short-term bias.
- ⚡Upper Psychological Target ($5,000): The main obstacle if a significant recovery occurs beyond the 200-day moving average (SMA).
- ⚡Critical Support 1 ($4,604): The 38.2% Fibonacci Retracement Level. A break below this level would confirm the failure of this week's recovery.
- ⚡Critical Support 2 ($4,412): The 23.6% Fibonacci Retracement Level. This area will be the next downside target if $4,600 fails to hold.
- ⚡Floor ($4,102): The previous swing low (March low). At this level, significant buying interest is expected to re-emerge.

การนำเสนอที่เกี่ยวข้อง
คำจำกัดสิทธิ์ความรับผิดชอบ
ข้อมูลและบทความไม่ได้มีวัตถุประสงค์เพื่อก่อให้เกิดกิจกรรมทางการเงิน, การลงทุน, การซื้อขาย, ข้อเสนอแนะ หรือคำแนะนำประเภทอื่น ๆ ที่ให้หรือรับรองโดย TradingView อ่านเพิ่มเติมใน ข้อกำหนดการใช้งาน
การนำเสนอที่เกี่ยวข้อง
คำจำกัดสิทธิ์ความรับผิดชอบ
ข้อมูลและบทความไม่ได้มีวัตถุประสงค์เพื่อก่อให้เกิดกิจกรรมทางการเงิน, การลงทุน, การซื้อขาย, ข้อเสนอแนะ หรือคำแนะนำประเภทอื่น ๆ ที่ให้หรือรับรองโดย TradingView อ่านเพิ่มเติมใน ข้อกำหนดการใช้งาน