
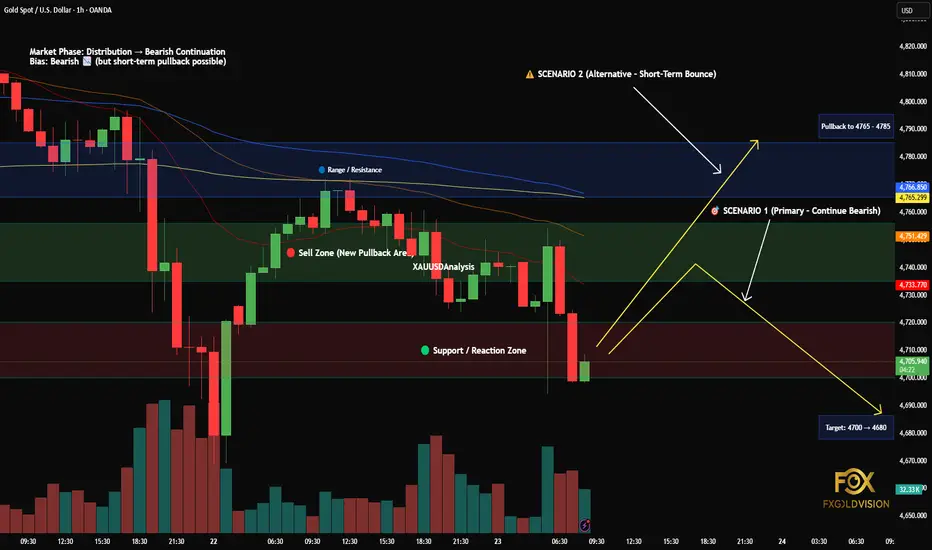
XAUUSD (Gold) analysis on the 1H timeframe.
Gold is currently in a bearish continuation phase after breaking down from a prior consolidation/distribution structure. The market is forming lower highs and lower lows, which confirms ongoing downside pressure.
At the moment, price is reacting near the 4700–4720 support zone, where a short-term bounce or pullback can occur.
🔻 Bearish Scenario (Primary)
If price pulls back into the 4735–4755 area, this zone may act as resistance.
A rejection here could lead to further downside continuation, with potential targets around:
4700 (near support)
4680 (next lower level)
This scenario aligns with the current market structure and trend direction.
🔺 Alternative Scenario (Short-Term Bounce)
If the support zone around 4700 holds strongly, price may move higher temporarily.
A bounce toward the 4765–4785 resistance zone is possible before the next directional move.
This would be considered a retracement, not a confirmed trend reversal.
📌 Key Concepts in This Analysis
Market Structure (Lower Highs / Lower Lows)
Support and Resistance Zones
Pullback Entries in Trending Markets
Scenario-Based Planning
⚠️ This analysis is for educational purposes only and reflects current market structure. Always use proper risk management.
Gold is currently in a bearish continuation phase after breaking down from a prior consolidation/distribution structure. The market is forming lower highs and lower lows, which confirms ongoing downside pressure.
At the moment, price is reacting near the 4700–4720 support zone, where a short-term bounce or pullback can occur.
🔻 Bearish Scenario (Primary)
If price pulls back into the 4735–4755 area, this zone may act as resistance.
A rejection here could lead to further downside continuation, with potential targets around:
4700 (near support)
4680 (next lower level)
This scenario aligns with the current market structure and trend direction.
🔺 Alternative Scenario (Short-Term Bounce)
If the support zone around 4700 holds strongly, price may move higher temporarily.
A bounce toward the 4765–4785 resistance zone is possible before the next directional move.
This would be considered a retracement, not a confirmed trend reversal.
📌 Key Concepts in This Analysis
Market Structure (Lower Highs / Lower Lows)
Support and Resistance Zones
Pullback Entries in Trending Markets
Scenario-Based Planning
⚠️ This analysis is for educational purposes only and reflects current market structure. Always use proper risk management.
ปิดการเทรด: ถึงเป้าหมายการทำกำไร
Primary bearish scenario played out perfectly as expected. Price respected the resistance zone and continued downward, reaching the 4680 target.This move confirms:
Strong bearish market structure 📉
Distribution phase continuation
Clean rejection from supply zone
After the pullback, sellers regained control and pushed price into the key target zone.
⚠️ Next Steps:
If price pulls back again toward 4720–4750, we may see another selling opportunity. However, short-term bounce is still possible from current support.
📊 This analysis is based on price action, structure, and smart money concepts.

การนำเสนอที่เกี่ยวข้อง
คำจำกัดสิทธิ์ความรับผิดชอบ
ข้อมูลและบทความไม่ได้มีวัตถุประสงค์เพื่อก่อให้เกิดกิจกรรมทางการเงิน, การลงทุน, การซื้อขาย, ข้อเสนอแนะ หรือคำแนะนำประเภทอื่น ๆ ที่ให้หรือรับรองโดย TradingView อ่านเพิ่มเติมใน ข้อกำหนดการใช้งาน
การนำเสนอที่เกี่ยวข้อง
คำจำกัดสิทธิ์ความรับผิดชอบ
ข้อมูลและบทความไม่ได้มีวัตถุประสงค์เพื่อก่อให้เกิดกิจกรรมทางการเงิน, การลงทุน, การซื้อขาย, ข้อเสนอแนะ หรือคำแนะนำประเภทอื่น ๆ ที่ให้หรือรับรองโดย TradingView อ่านเพิ่มเติมใน ข้อกำหนดการใช้งาน