
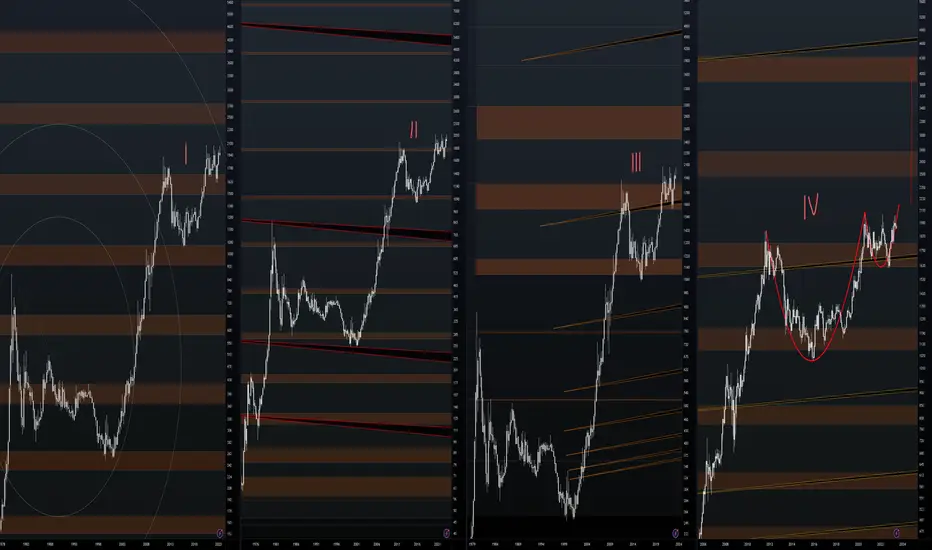
This Fibonacci Clustering in Gold (XAU) is a sight to see. Unbelievably, this schematic tracks how gold crashed a whopping 70 Percent to its low in 1999... NOW it is on track to go up over 100 percent through my patterns shown numerically...
I. Fib Circle Base
-The journey begins with a Fib circle on gold's 3 month chart, formed with the base extension schematic for our projections.
II. Initial Fib Spikes
-We then incorporate significant tools that visualize the 70% drop from 1980 to 2000... movements that CREATE the Fibonacci circle, laying the groundwork for our next Fibonacci extensions.
III. Macro-Scale Spikes
-Adding a second pair of spikes on a macro scale validates our base schematic and contributes to further Fibonacci projections.
IV. Monthly Macro Spikes / Cup-and-Handle
-Finally, a micro time frame of III's pair of spikes and a bullish cup-and-handle formation strengthen our projection of gold's path to $4500.
Below I have linked my original gold schematic. Followed by my DXY Crash schematic.
I. Fib Circle Base
-The journey begins with a Fib circle on gold's 3 month chart, formed with the base extension schematic for our projections.
II. Initial Fib Spikes
-We then incorporate significant tools that visualize the 70% drop from 1980 to 2000... movements that CREATE the Fibonacci circle, laying the groundwork for our next Fibonacci extensions.
III. Macro-Scale Spikes
-Adding a second pair of spikes on a macro scale validates our base schematic and contributes to further Fibonacci projections.
IV. Monthly Macro Spikes / Cup-and-Handle
-Finally, a micro time frame of III's pair of spikes and a bullish cup-and-handle formation strengthen our projection of gold's path to $4500.
Below I have linked my original gold schematic. Followed by my DXY Crash schematic.
บันทึก
Here we have a dumbed down version of the (3 MONTH) schematic into a WEEKLY Schematic.
บันทึก
DAILY CURRENT BASE SCHEMATIC

การนำเสนอที่เกี่ยวข้อง
คำจำกัดสิทธิ์ความรับผิดชอบ
ข้อมูลและบทความไม่ได้มีวัตถุประสงค์เพื่อก่อให้เกิดกิจกรรมทางการเงิน, การลงทุน, การซื้อขาย, ข้อเสนอแนะ หรือคำแนะนำประเภทอื่น ๆ ที่ให้หรือรับรองโดย TradingView อ่านเพิ่มเติมใน ข้อกำหนดการใช้งาน
การนำเสนอที่เกี่ยวข้อง
คำจำกัดสิทธิ์ความรับผิดชอบ
ข้อมูลและบทความไม่ได้มีวัตถุประสงค์เพื่อก่อให้เกิดกิจกรรมทางการเงิน, การลงทุน, การซื้อขาย, ข้อเสนอแนะ หรือคำแนะนำประเภทอื่น ๆ ที่ให้หรือรับรองโดย TradingView อ่านเพิ่มเติมใน ข้อกำหนดการใช้งาน