
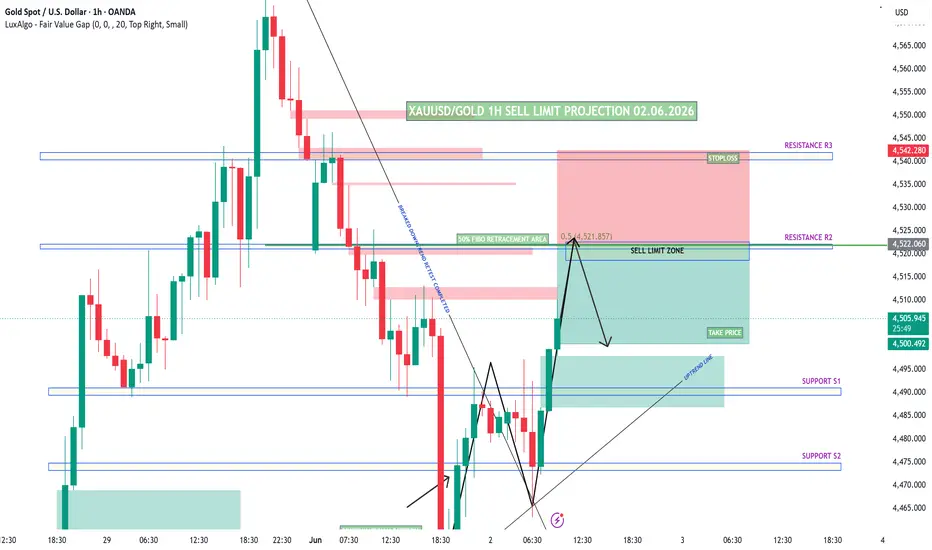
Your chart is showing a bearish retracement setup after a strong downward trend.
📌 Market Structure
The overall trend remains bearish.
Price previously broke structure to the downside and completed a retracement.
Currently, gold is making a bullish pullback into a key resistance zone.
📌 Sell Limit Zone
Entry Area: 4520 – 4522
Reasons:
50% Fibonacci Retracement level (4521.85)
Resistance R2 area
Previous supply/resistance zone
Confluence of multiple technical levels
This makes the zone attractive for institutional selling pressure.
📌 Market Structure
The overall trend remains bearish.
Price previously broke structure to the downside and completed a retracement.
Currently, gold is making a bullish pullback into a key resistance zone.
📌 Sell Limit Zone
Entry Area: 4520 – 4522
Reasons:
50% Fibonacci Retracement level (4521.85)
Resistance R2 area
Previous supply/resistance zone
Confluence of multiple technical levels
This makes the zone attractive for institutional selling pressure.

คำจำกัดสิทธิ์ความรับผิดชอบ
ข้อมูลและบทความไม่ได้มีวัตถุประสงค์เพื่อก่อให้เกิดกิจกรรมทางการเงิน, การลงทุน, การซื้อขาย, ข้อเสนอแนะ หรือคำแนะนำประเภทอื่น ๆ ที่ให้หรือรับรองโดย TradingView อ่านเพิ่มเติมใน ข้อกำหนดการใช้งาน
คำจำกัดสิทธิ์ความรับผิดชอบ
ข้อมูลและบทความไม่ได้มีวัตถุประสงค์เพื่อก่อให้เกิดกิจกรรมทางการเงิน, การลงทุน, การซื้อขาย, ข้อเสนอแนะ หรือคำแนะนำประเภทอื่น ๆ ที่ให้หรือรับรองโดย TradingView อ่านเพิ่มเติมใน ข้อกำหนดการใช้งาน