
Key Points (Revised):
* Asset: Gold Spot / U.S. Dollar (XAUUSD)
* Timeframe: 1-hour chart
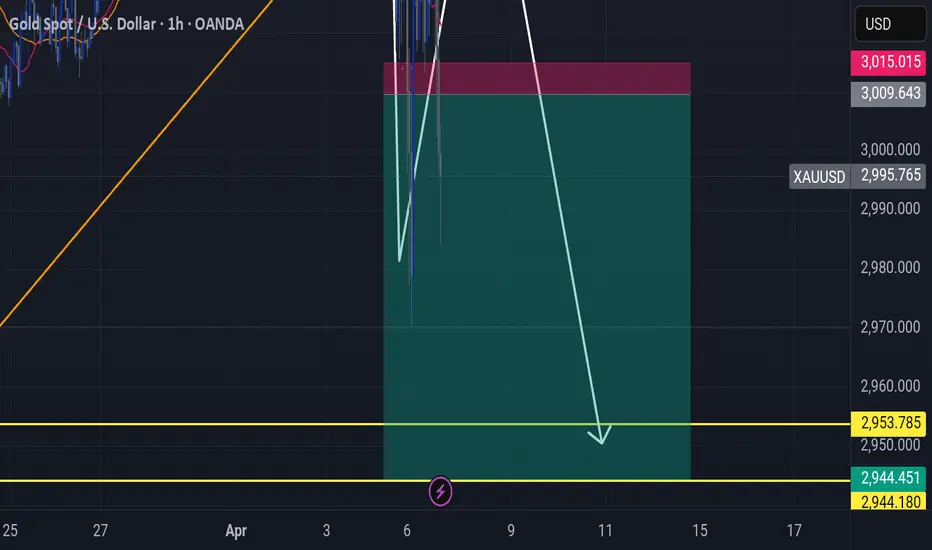
* Recent Price Action: A sharp upward move has occurred, reaching the red highlighted zone (potential resistance).
* Potential Reversal Zone: The red rectangular area between approximately 3009.643 and 3015.015 now appears to be acting as a resistance zone.
* Target Zone: The green rectangular area between approximately 2953.785 and 2944.180 is now the potential target for a downward move.
* Proposed Pattern: The price action suggests a potential rejection at the resistance zone, leading to a downward move.
Trading Idea (Revised):
The updated chart suggests a potential short (sell) trade opportunity. The idea is to enter a short position within or near the red highlighted zone (potential resistance), anticipating a downward move towards the green highlighted zone (potential support/target). This is based on the price reaching a potential resistance level and showing signs of rejection.
* Asset: Gold Spot / U.S. Dollar (XAUUSD)
* Timeframe: 1-hour chart
* Recent Price Action: A sharp upward move has occurred, reaching the red highlighted zone (potential resistance).
* Potential Reversal Zone: The red rectangular area between approximately 3009.643 and 3015.015 now appears to be acting as a resistance zone.
* Target Zone: The green rectangular area between approximately 2953.785 and 2944.180 is now the potential target for a downward move.
* Proposed Pattern: The price action suggests a potential rejection at the resistance zone, leading to a downward move.
Trading Idea (Revised):
The updated chart suggests a potential short (sell) trade opportunity. The idea is to enter a short position within or near the red highlighted zone (potential resistance), anticipating a downward move towards the green highlighted zone (potential support/target). This is based on the price reaching a potential resistance level and showing signs of rejection.

คำจำกัดสิทธิ์ความรับผิดชอบ
ข้อมูลและบทความไม่ได้มีวัตถุประสงค์เพื่อก่อให้เกิดกิจกรรมทางการเงิน, การลงทุน, การซื้อขาย, ข้อเสนอแนะ หรือคำแนะนำประเภทอื่น ๆ ที่ให้หรือรับรองโดย TradingView อ่านเพิ่มเติมใน ข้อกำหนดการใช้งาน
คำจำกัดสิทธิ์ความรับผิดชอบ
ข้อมูลและบทความไม่ได้มีวัตถุประสงค์เพื่อก่อให้เกิดกิจกรรมทางการเงิน, การลงทุน, การซื้อขาย, ข้อเสนอแนะ หรือคำแนะนำประเภทอื่น ๆ ที่ให้หรือรับรองโดย TradingView อ่านเพิ่มเติมใน ข้อกำหนดการใช้งาน