
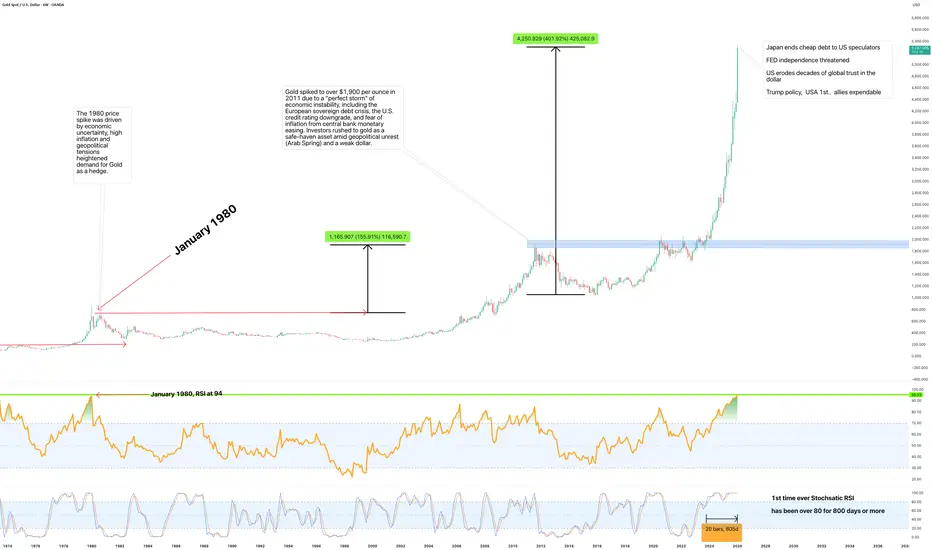
Fort the 2nd time in history the Relative Strength Index (RSI) has touched 95 as shown on the above 6 week chart. The previous time was back in 1968, or 57 years ago.
After 1968 the highest RSI was 94, back in January 1980. Not long after the dollar came off the Gold standard. A -63% crash followed. The 2011 a -45% crash printed with an RSI at 84.
The Relative Strength Index (RSI) is a popular momentum oscillator used in technical analysis to measure the speed and magnitude of recent price changes. It helps traders identify overbought or oversold conditions in a stock or asset.
Range: 0 to 100.
Common Thresholds:
Above 70: Overbought (potential sell signal).
Below 30: Oversold (potential buy signal).
Should a value of 95 be considered a buying opportunity like many Gold bugs are calling for?
Short answer: No.
An RSI of 95 is extremely rare and almost never a buying opportunity based on the standard RSI rule. In fact, it's a strong warning signal for a potential pullback or reversal.
Here’s a detailed breakdown of why buying at RSI 95 is typically a bad idea:
1. Extreme Overbought Condition
RSI above 70 is considered overbought. At 95, the asset is in an extreme parabolic state. This often indicates a buying frenzy or a "blow-off top," which is unsustainable. A sharp correction is highly probable.
2. Momentum exhaustion
The Stochastic RSI measures momentum. A stochastic RSI reading of 80 and above is overbought. 90 is Apollo VI on launch, 99 where we are now, is the bit where mission control’s gone quiet, the monkey’s pressed all the buttons, and everyone’s pretending this was always part of the plan while gravity waits patiently to do what it does best.
For the 1st time ever momentum has just past 800 days over 80. The previous record was around 500 days.
3. High risk of mean reversion
The core principle behind RSI is mean reversion prices tend to return to their average. The farther the RSI moves from 50, the stronger the gravitational pull back toward it. An RSI of 95 is like a stretched rubber band ready to snap back violently. The mean price is currently around $3000
4. Potential for false signals in strong trends
While it's true that in a very strong bullish trend, the RSI can remain "overbought" (above 70) for extended periods, a reading of 95 is almost never sustainable. Even in a powerful uptrend, this level suggests a short-term peak is imminent.
Is Bitcoin a good rotation?
Short answer: No
In fact, there’s strong evidence Bitcoin will collapse as hard and as fast as Gold during 2026. Don’t fall for this super cycle nonsense influencers are pumping out.
Is this time different?
No. It’s still people reaching for the "emergency exit." when all hell breaks, and that is understandable. Look at the headlines around the world today. The United States government has never seemed more chaotic for us outsiders, policy determined via truth social posts, Allies threatened with economic penalties if they don’t take the knee, ICE agents with judicial executions if citizens if they look the wrong way, tariffs handed out like flyers, cost of everyday food stuffs exploding in price.. what a legacy.
Will I short gold?
No. I never short any market, there’s never any need to do that. Only long what is oversold and beaten down.
Ww
=================================================================
Disclaimer
Right. Before anyone starts screaming, crying, or remortgaging their house based on this, calm down. This isn’t financial advice. It’s not advice at all. It’s numbers, history, and a bit of common sense, laid out by someone who can still remember what happened the last time people said “this time is different.”
If you choose to ignore it because a bloke on YouTube with a laser-eyed thumbnail says gold (or Bitcoin, or tulips, or Beanie Babies) is going to the moon, fine. Crack on. That’s natural selection with candlesticks.
Markets don’t care about your fear, your politics, your hashtags, or your “emergency exit” fantasies. Gravity still works. Rubber bands still snap. And charts don’t suddenly develop feelings because the world’s gone a bit mad.
So read it, don’t worship it. Think for yourself. And if it all goes wrong, don’t email me. I’ll be busy not saying “I told you so,” while very much thinking it.
After 1968 the highest RSI was 94, back in January 1980. Not long after the dollar came off the Gold standard. A -63% crash followed. The 2011 a -45% crash printed with an RSI at 84.
The Relative Strength Index (RSI) is a popular momentum oscillator used in technical analysis to measure the speed and magnitude of recent price changes. It helps traders identify overbought or oversold conditions in a stock or asset.
Range: 0 to 100.
Common Thresholds:
Above 70: Overbought (potential sell signal).
Below 30: Oversold (potential buy signal).
Should a value of 95 be considered a buying opportunity like many Gold bugs are calling for?
Short answer: No.
An RSI of 95 is extremely rare and almost never a buying opportunity based on the standard RSI rule. In fact, it's a strong warning signal for a potential pullback or reversal.
Here’s a detailed breakdown of why buying at RSI 95 is typically a bad idea:
1. Extreme Overbought Condition
RSI above 70 is considered overbought. At 95, the asset is in an extreme parabolic state. This often indicates a buying frenzy or a "blow-off top," which is unsustainable. A sharp correction is highly probable.
2. Momentum exhaustion
The Stochastic RSI measures momentum. A stochastic RSI reading of 80 and above is overbought. 90 is Apollo VI on launch, 99 where we are now, is the bit where mission control’s gone quiet, the monkey’s pressed all the buttons, and everyone’s pretending this was always part of the plan while gravity waits patiently to do what it does best.
For the 1st time ever momentum has just past 800 days over 80. The previous record was around 500 days.
3. High risk of mean reversion
The core principle behind RSI is mean reversion prices tend to return to their average. The farther the RSI moves from 50, the stronger the gravitational pull back toward it. An RSI of 95 is like a stretched rubber band ready to snap back violently. The mean price is currently around $3000
4. Potential for false signals in strong trends
While it's true that in a very strong bullish trend, the RSI can remain "overbought" (above 70) for extended periods, a reading of 95 is almost never sustainable. Even in a powerful uptrend, this level suggests a short-term peak is imminent.
Is Bitcoin a good rotation?
Short answer: No
In fact, there’s strong evidence Bitcoin will collapse as hard and as fast as Gold during 2026. Don’t fall for this super cycle nonsense influencers are pumping out.
Is this time different?
No. It’s still people reaching for the "emergency exit." when all hell breaks, and that is understandable. Look at the headlines around the world today. The United States government has never seemed more chaotic for us outsiders, policy determined via truth social posts, Allies threatened with economic penalties if they don’t take the knee, ICE agents with judicial executions if citizens if they look the wrong way, tariffs handed out like flyers, cost of everyday food stuffs exploding in price.. what a legacy.
Will I short gold?
No. I never short any market, there’s never any need to do that. Only long what is oversold and beaten down.
Ww
=================================================================
Disclaimer
Right. Before anyone starts screaming, crying, or remortgaging their house based on this, calm down. This isn’t financial advice. It’s not advice at all. It’s numbers, history, and a bit of common sense, laid out by someone who can still remember what happened the last time people said “this time is different.”
If you choose to ignore it because a bloke on YouTube with a laser-eyed thumbnail says gold (or Bitcoin, or tulips, or Beanie Babies) is going to the moon, fine. Crack on. That’s natural selection with candlesticks.
Markets don’t care about your fear, your politics, your hashtags, or your “emergency exit” fantasies. Gravity still works. Rubber bands still snap. And charts don’t suddenly develop feelings because the world’s gone a bit mad.
So read it, don’t worship it. Think for yourself. And if it all goes wrong, don’t email me. I’ll be busy not saying “I told you so,” while very much thinking it.
การซื้อขายยังคงดำเนินอยู่
It begins.. . Price action drops almost $500 in 50 minutes.Gold bug 24hrs earlier:
"I’m calling gold to 8000$ and oil to $380"
บันทึก
$1000 crash since publication. Maddening.Expect a bounce of sorts from $4200, however mean reversion of price action is likely, which is around $2700 at this time.
Quarter 1 is going to be one of the reddest quarters in history for Gold.
บันทึก
Price action is on the verge of a historic collapse. Instead of ceasing the opportunity to protect purchasing power Gold bugs will double down for higher highs. Greed knows no bounds.20 day chart
บันทึก
Gold market crash in progress. -10% so far. Despite all the bearish technical indications, Gold bugs have never been more bullish.บันทึก
Gold crashes through the 4600 support like it din't exist.Imagine buying Gold amidst all the January hype (see comments below, they were backing up the truck) to be down $1000 not fifty days later. Thunder bolts of lightening.
บันทึก
Price action has crashed 22% from its all time high and more importantly entered the Bollinger Band area on the main chart timeframe.What does this signal?
The Mean price of the Bollinger Band sits currently at an overbought price of around $3000. This level will act like a magnet for current price action. Expect the next test to be around this level.
บันทึก
Price action collapsing quicker than UK governments. Now down an additional 10% as June comes to a close.Would you buy this 6 month candle print in 6 days?
Influencers all over call for a "buy the dip" opportunity as $8k - 10k in July will be next. Seriously.
When all is said in done, Price über alles.. respect what the chart is telling you. That's where the News is at.

คำจำกัดสิทธิ์ความรับผิดชอบ
ข้อมูลและบทความไม่ได้มีวัตถุประสงค์เพื่อก่อให้เกิดกิจกรรมทางการเงิน, การลงทุน, การซื้อขาย, ข้อเสนอแนะ หรือคำแนะนำประเภทอื่น ๆ ที่ให้หรือรับรองโดย TradingView อ่านเพิ่มเติมใน ข้อกำหนดการใช้งาน
คำจำกัดสิทธิ์ความรับผิดชอบ
ข้อมูลและบทความไม่ได้มีวัตถุประสงค์เพื่อก่อให้เกิดกิจกรรมทางการเงิน, การลงทุน, การซื้อขาย, ข้อเสนอแนะ หรือคำแนะนำประเภทอื่น ๆ ที่ให้หรือรับรองโดย TradingView อ่านเพิ่มเติมใน ข้อกำหนดการใช้งาน