
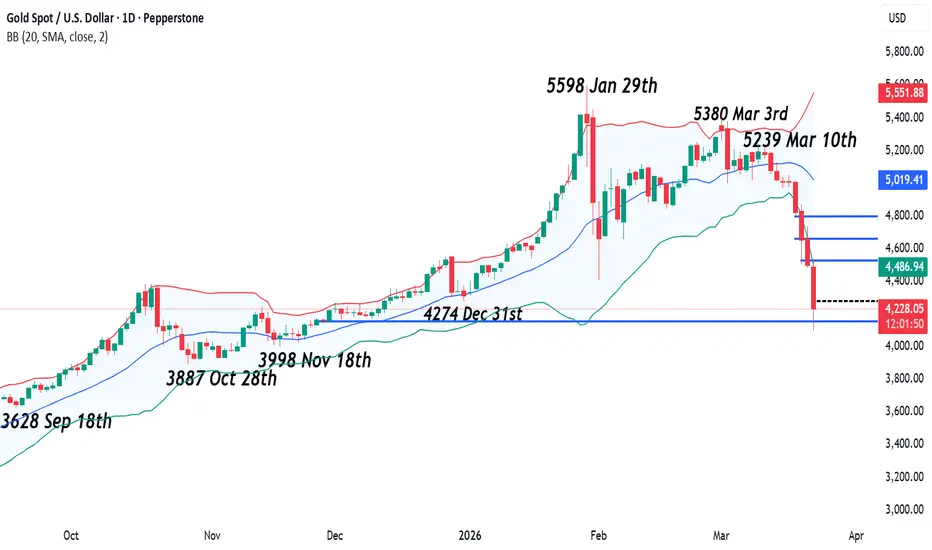
The current backdrop for precious metals is challenging to say the least. Last week, Gold prices experienced their biggest weekly fall since the early 1980s. A drop of over $500 or 10% from opening levels at 5010 on Monday (March 16th) to close at 2 month lows of 4497. This move has extended further this morning to register a 5 month low at 4102, wiping out the entire 2026 gains for the shiny metal in the process.
The latest catalyst for the drop could be attributed to weekend comments from US President Trump and Iran which may represent a hardening of their positions on the conflict, creating the possibility for a new escalation at the start of this new trading week. First, late on Saturday President Trump gave Iran a 48 hour deadline to reopen the Strait of Hormuz or have its power plants bombed, to which the ruling Iranian regime responded by saying if that were to happen, it would close the key Hormuz shipping lane entirely and target energy, IT and desalination infrastructure linked to the US and Israel (Bloomberg).
With the Iran conflict now entering its 4th week, with no clear end game in sight, this has led markets to raise their inflation outlook, which has cast doubt on the ability of the Federal Reserve to deliver an interest rate cut in the first half of 2026, possibly even across the year in its entirety. This type of backdrop can weigh on the price of Gold as it pays no dividend or interest, making it less desirable to hold in the face of other yielding opportunities in assets such as cash.
Looking forward, after such a deep fall to a new low, Gold traders may be looking at how events in the Middle East unfold across the week once President Trump’s 48 hour deadline passes. In this increasingly volatile environment, it can be useful to understand the technical trends and key support or resistance levels that may impact the direction of prices.
Technical Update: Increasing Volatility Sees Gold Testing Next Support:
While Gold saw a strong recovery from the February 2nd low to the March 3rd high, recent price action has turned sharply lower again. The near 24% decline into this morning’s current low of 4099 (8.00am GMT) raises the question for traders: Can the current phase of weakness carry further?
While it is impossible to say for certain, there is a key support area in focus today that may help determine Gold’s next directional moves.
Potential Support Focus:
As shown on the chart below, the 4157 level, which is equal to the 61.8% Fibonacci retracement of the August 2025 to January 2026 advance, is now under pressure. This is a level that traders may anticipate being a key support focus. However, price action this morning is currently threatening the possibility of closes below this level on a daily basis.

If downside pressure continues to build and Gold closes below 4157, it could suggest risks are for a deeper phase of weakness. Such a move might open declines toward 3998, the November 18th low, possibly even further toward 3887, the October 28th extreme.
Potential Resistance Focus:
If closing breaks below the 4157 support aren’t seen and Gold attempts to recover, attention may turn to potential resistance at 4317, equal to half Monday’s current range. A break above this level would not be an outright positive signal on its own, but it might indicate that upside pressure is beginning to rebuild once more.
If 4317 is cleared on a closing basis, higher resistance levels will potentially come back into play, with focus first on 4529, the 38% retracement and then 4664, equal to the higher 50% level.
The material provided here has not been prepared accordance with legal requirements designed to promote the independence of investment research and as such is considered to be a marketing communication. Whilst it is not subject to any prohibition on dealing ahead of the dissemination of investment research, we will not seek to take any advantage before providing it to our clients.
Pepperstone doesn’t represent that the material provided here is accurate, current or complete, and therefore shouldn’t be relied upon as such. The information, whether from a third party or not, isn’t to be considered as a recommendation; or an offer to buy or sell; or the solicitation of an offer to buy or sell any security, financial product or instrument; or to participate in any particular trading strategy. It does not take into account readers’ financial situation or investment objectives. We advise any readers of this content to seek their own advice. Without the approval of Pepperstone, reproduction or redistribution of this information isn’t permitted.
The latest catalyst for the drop could be attributed to weekend comments from US President Trump and Iran which may represent a hardening of their positions on the conflict, creating the possibility for a new escalation at the start of this new trading week. First, late on Saturday President Trump gave Iran a 48 hour deadline to reopen the Strait of Hormuz or have its power plants bombed, to which the ruling Iranian regime responded by saying if that were to happen, it would close the key Hormuz shipping lane entirely and target energy, IT and desalination infrastructure linked to the US and Israel (Bloomberg).
With the Iran conflict now entering its 4th week, with no clear end game in sight, this has led markets to raise their inflation outlook, which has cast doubt on the ability of the Federal Reserve to deliver an interest rate cut in the first half of 2026, possibly even across the year in its entirety. This type of backdrop can weigh on the price of Gold as it pays no dividend or interest, making it less desirable to hold in the face of other yielding opportunities in assets such as cash.
Looking forward, after such a deep fall to a new low, Gold traders may be looking at how events in the Middle East unfold across the week once President Trump’s 48 hour deadline passes. In this increasingly volatile environment, it can be useful to understand the technical trends and key support or resistance levels that may impact the direction of prices.
Technical Update: Increasing Volatility Sees Gold Testing Next Support:
While Gold saw a strong recovery from the February 2nd low to the March 3rd high, recent price action has turned sharply lower again. The near 24% decline into this morning’s current low of 4099 (8.00am GMT) raises the question for traders: Can the current phase of weakness carry further?
While it is impossible to say for certain, there is a key support area in focus today that may help determine Gold’s next directional moves.
Potential Support Focus:
As shown on the chart below, the 4157 level, which is equal to the 61.8% Fibonacci retracement of the August 2025 to January 2026 advance, is now under pressure. This is a level that traders may anticipate being a key support focus. However, price action this morning is currently threatening the possibility of closes below this level on a daily basis.
If downside pressure continues to build and Gold closes below 4157, it could suggest risks are for a deeper phase of weakness. Such a move might open declines toward 3998, the November 18th low, possibly even further toward 3887, the October 28th extreme.
Potential Resistance Focus:
If closing breaks below the 4157 support aren’t seen and Gold attempts to recover, attention may turn to potential resistance at 4317, equal to half Monday’s current range. A break above this level would not be an outright positive signal on its own, but it might indicate that upside pressure is beginning to rebuild once more.
If 4317 is cleared on a closing basis, higher resistance levels will potentially come back into play, with focus first on 4529, the 38% retracement and then 4664, equal to the higher 50% level.
The material provided here has not been prepared accordance with legal requirements designed to promote the independence of investment research and as such is considered to be a marketing communication. Whilst it is not subject to any prohibition on dealing ahead of the dissemination of investment research, we will not seek to take any advantage before providing it to our clients.
Pepperstone doesn’t represent that the material provided here is accurate, current or complete, and therefore shouldn’t be relied upon as such. The information, whether from a third party or not, isn’t to be considered as a recommendation; or an offer to buy or sell; or the solicitation of an offer to buy or sell any security, financial product or instrument; or to participate in any particular trading strategy. It does not take into account readers’ financial situation or investment objectives. We advise any readers of this content to seek their own advice. Without the approval of Pepperstone, reproduction or redistribution of this information isn’t permitted.

Global risk Warning CFDs are complex instruments and come with a high risk of losing money rapidly due to leverage. Between 74-89% of retail investor accounts lose money when trading in CFDs. You should consider whether you understand how CFD
คำจำกัดสิทธิ์ความรับผิดชอบ
ข้อมูลและบทความไม่ได้มีวัตถุประสงค์เพื่อก่อให้เกิดกิจกรรมทางการเงิน, การลงทุน, การซื้อขาย, ข้อเสนอแนะ หรือคำแนะนำประเภทอื่น ๆ ที่ให้หรือรับรองโดย TradingView อ่านเพิ่มเติมใน ข้อกำหนดการใช้งาน
Global risk Warning CFDs are complex instruments and come with a high risk of losing money rapidly due to leverage. Between 74-89% of retail investor accounts lose money when trading in CFDs. You should consider whether you understand how CFD
คำจำกัดสิทธิ์ความรับผิดชอบ
ข้อมูลและบทความไม่ได้มีวัตถุประสงค์เพื่อก่อให้เกิดกิจกรรมทางการเงิน, การลงทุน, การซื้อขาย, ข้อเสนอแนะ หรือคำแนะนำประเภทอื่น ๆ ที่ให้หรือรับรองโดย TradingView อ่านเพิ่มเติมใน ข้อกำหนดการใช้งาน