
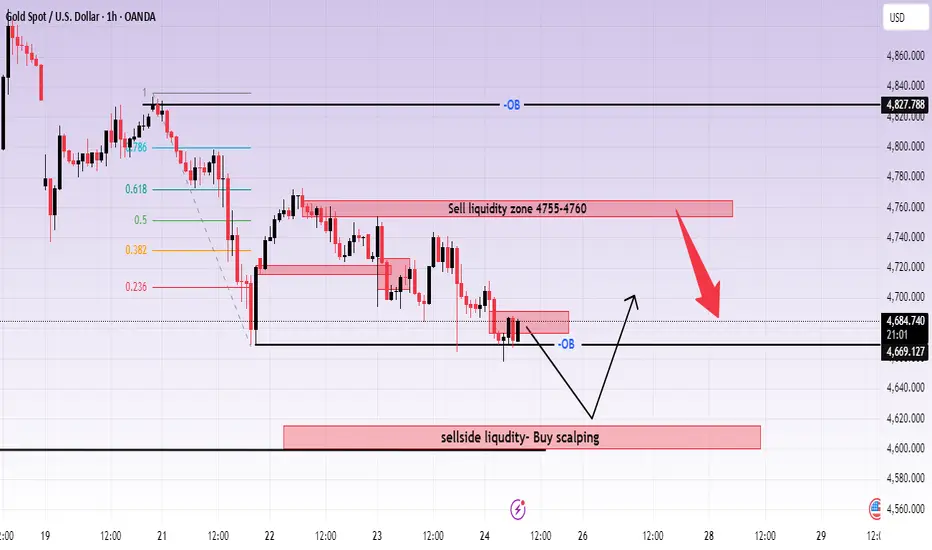
XAUUSD H1: Pressure Builds Below Resistance
Gold remains under pressure on the H1 chart after failing to recover above the 4755–4760 sell liquidity zone. Thursday’s fresh supply tone, combined with renewed pressure on the US Dollar from Hormuz-related risk and persistent inflation concerns, is keeping the market focused on a less dovish Fed path, which continues to weigh on non-yielding assets like gold.
Fundamental backdrop
The current macro backdrop still favors a cautious bearish view on gold.
Geopolitical tension around the Strait of Hormuz is keeping market volatility elevated, while inflation concerns are pushing expectations toward a firmer Fed stance rather than an easier one. That combination reduces the room for gold to build a clean upside recovery and keeps price vulnerable to deeper pullbacks, especially while technical resistance remains intact.
Technical structure on H1
The short-term structure remains weak.
Price is still trading below the 4755–4760 sell liquidity zone, which continues to cap any recovery attempt. The recent bounce from the lows has been modest and corrective, with no strong bullish displacement yet to suggest that buyers have regained control.
The immediate level to watch is 4669.127, which is acting as the current downside pivot. As long as price stays around or below this support line, the market remains exposed to another sweep lower.
Below that, the next key area is the broader 4600 sell-side liquidity zone, marked on the chart as the main reaction region. This is the area where gold may look for a stronger short-term base if sellers continue pressing lower first.
On the upside, 4755–4760 remains the first resistance that buyers would need to reclaim to shift the short-term tone, while 4827.788 is still the larger OB resistance and the broader invalidation level for the bearish structure.
What order flow is suggesting
Order flow still leans bearish in the short term:
price remains capped below 4755–4760
current rebound strength is limited
liquidity below 4669.127 remains exposed
the market may still be drawn toward the 4600 support shelf before any stronger recovery develops
This keeps the downside scenario active unless buyers can reclaim resistance with stronger momentum.
Trading scenarios
Scenario 1: Rebound into resistance, then downside resumes
If gold rebounds into 4755–4760 but fails to break above it, sellers may continue controlling the structure.
Entry: bearish rejection from 4755–4760
SL: above the local high
TP1: 4700
TP2: 4669.127
TP3: 4600
Scenario 2: Breakdown below 4669.127
If price closes decisively below 4669.127, gold may extend lower into the 4600 sell-side liquidity zone.
Entry: confirmed break below 4669.127
SL: above broken support
TP1: 4630
TP2: 4600
Scenario 3: Sweep 4600, then rebound
If gold trades lower first and taps the 4600 liquidity zone with a clear reaction, buyers may attempt a corrective recovery.
Entry: bullish confirmation from 4600
SL: below the sweep low
TP1: 4669.127
TP2: 4700
TP3: 4755–4760
Key levels to watch
4755–4760 → sell liquidity resistance
4700 → intraday recovery pivot
4669.127 → key short-term support
4600 → sell-side liquidity / reaction zone
4827.788 → major OB resistance
Conclusion
Gold still looks vulnerable on the H1 chart while trading below the 4755–4760 resistance zone. The current macro backdrop, with inflation concerns and a less dovish Fed narrative, continues to support bearish pressure in the short term. As long as buyers fail to reclaim resistance, the market may remain exposed to a deeper move toward 4669.127 and potentially the 4600 liquidity zone below.
Gold remains under pressure on the H1 chart after failing to recover above the 4755–4760 sell liquidity zone. Thursday’s fresh supply tone, combined with renewed pressure on the US Dollar from Hormuz-related risk and persistent inflation concerns, is keeping the market focused on a less dovish Fed path, which continues to weigh on non-yielding assets like gold.
Fundamental backdrop
The current macro backdrop still favors a cautious bearish view on gold.
Geopolitical tension around the Strait of Hormuz is keeping market volatility elevated, while inflation concerns are pushing expectations toward a firmer Fed stance rather than an easier one. That combination reduces the room for gold to build a clean upside recovery and keeps price vulnerable to deeper pullbacks, especially while technical resistance remains intact.
Technical structure on H1
The short-term structure remains weak.
Price is still trading below the 4755–4760 sell liquidity zone, which continues to cap any recovery attempt. The recent bounce from the lows has been modest and corrective, with no strong bullish displacement yet to suggest that buyers have regained control.
The immediate level to watch is 4669.127, which is acting as the current downside pivot. As long as price stays around or below this support line, the market remains exposed to another sweep lower.
Below that, the next key area is the broader 4600 sell-side liquidity zone, marked on the chart as the main reaction region. This is the area where gold may look for a stronger short-term base if sellers continue pressing lower first.
On the upside, 4755–4760 remains the first resistance that buyers would need to reclaim to shift the short-term tone, while 4827.788 is still the larger OB resistance and the broader invalidation level for the bearish structure.
What order flow is suggesting
Order flow still leans bearish in the short term:
price remains capped below 4755–4760
current rebound strength is limited
liquidity below 4669.127 remains exposed
the market may still be drawn toward the 4600 support shelf before any stronger recovery develops
This keeps the downside scenario active unless buyers can reclaim resistance with stronger momentum.
Trading scenarios
Scenario 1: Rebound into resistance, then downside resumes
If gold rebounds into 4755–4760 but fails to break above it, sellers may continue controlling the structure.
Entry: bearish rejection from 4755–4760
SL: above the local high
TP1: 4700
TP2: 4669.127
TP3: 4600
Scenario 2: Breakdown below 4669.127
If price closes decisively below 4669.127, gold may extend lower into the 4600 sell-side liquidity zone.
Entry: confirmed break below 4669.127
SL: above broken support
TP1: 4630
TP2: 4600
Scenario 3: Sweep 4600, then rebound
If gold trades lower first and taps the 4600 liquidity zone with a clear reaction, buyers may attempt a corrective recovery.
Entry: bullish confirmation from 4600
SL: below the sweep low
TP1: 4669.127
TP2: 4700
TP3: 4755–4760
Key levels to watch
4755–4760 → sell liquidity resistance
4700 → intraday recovery pivot
4669.127 → key short-term support
4600 → sell-side liquidity / reaction zone
4827.788 → major OB resistance
Conclusion
Gold still looks vulnerable on the H1 chart while trading below the 4755–4760 resistance zone. The current macro backdrop, with inflation concerns and a less dovish Fed narrative, continues to support bearish pressure in the short term. As long as buyers fail to reclaim resistance, the market may remain exposed to a deeper move toward 4669.127 and potentially the 4600 liquidity zone below.

การนำเสนอที่เกี่ยวข้อง
คำจำกัดสิทธิ์ความรับผิดชอบ
ข้อมูลและบทความไม่ได้มีวัตถุประสงค์เพื่อก่อให้เกิดกิจกรรมทางการเงิน, การลงทุน, การซื้อขาย, ข้อเสนอแนะ หรือคำแนะนำประเภทอื่น ๆ ที่ให้หรือรับรองโดย TradingView อ่านเพิ่มเติมใน ข้อกำหนดการใช้งาน
การนำเสนอที่เกี่ยวข้อง
คำจำกัดสิทธิ์ความรับผิดชอบ
ข้อมูลและบทความไม่ได้มีวัตถุประสงค์เพื่อก่อให้เกิดกิจกรรมทางการเงิน, การลงทุน, การซื้อขาย, ข้อเสนอแนะ หรือคำแนะนำประเภทอื่น ๆ ที่ให้หรือรับรองโดย TradingView อ่านเพิ่มเติมใน ข้อกำหนดการใช้งาน