
#XAUUSD: Sellers Pressure Has Increased Possible +3000 Pips Move
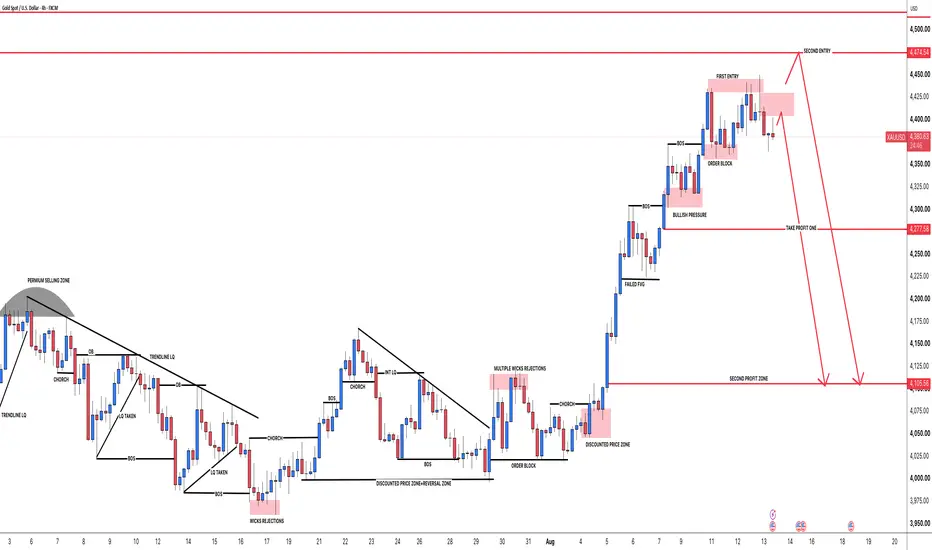
📌The price of gold (XAUUSD) has experienced a significant bullish expansion from the discounted-price region below 4,100. This advance developed through a sequence of liquidity events: sell-side liquidity was collected, bullish CHOCH and BOS formations occurred, demand and order blocks were respected and a previously bearish fair value gap failed.
📌The failed fair value gap acted as an inversion signal and was followed by strong displacement through the 4,300 and 4,370 structure levels. The completed leg into the current highs was therefore structurally bullish.
📌However, the price location has now changed. At 4,391.50, gold is no longer trading in discount. It is positioned in the premium portion of the active 4H dealing range after a highly imbalanced rally. Price is now approaching stacked supply and buy-side liquidity, creating the conditions for distribution and bearish repricing provided lower-timeframe order flow confirms the reversal.
I📌mportantly, the 4H chart has not yet produced a fully confirmed bearish market structure shift. Therefore, this is a conditional short setup from premium, not a blind market sell.
Market Structure and Liquidity Narrative
The earlier sections of the chart repeatedly demonstrate the same institutional delivery:
🔺Liquidity forms around swing highs, equal lows or trendline liquidity.
🔺Price raids that liquidity.
🔺A CHOCH or market structure shift develops.
🔺Displacement then carries price towards the opposite side of the range.
The late-July rejection from approximately 3,960–4,000 was the most important recent example. Sell-side liquidity was collected before price reversed and broke several external highs.
The August expansion subsequently printed consecutive bullish BOS signals. The bullish order block around 4,355–4,372 and the earlier bullish-pressure zone around 4,302–4,324 remain important structural footprints from that move.
A decisive break below the 4,355–4,372 order block would be the first significant evidence that bullish delivery is failing. A subsequent retest of that broken order block as resistance could transform it into a bearish breaker and strengthen the downside thesis.
Premium Zones and Entry Models
The latest rally has delivered price into a premium array containing several layers of supply.
Near-term mitigation zone: 4,404–4,429
🔺This is the lower supply area used by the chart’s shorter projected path. A corrective bounce into this zone could mitigate newly created bearish supply before price begins moving towards the downside objectives.
First-entry zone: 4,430–4,445
🔺This is the primary premium selling zone marked on the chart. Price has already traded into this area and produced an initial rejection. Recent highs within and above the zone hold buy-side liquidity, meaning another test could first sweep stops before a bearish move develops.
Second-entry level: 4,474.54
🔺If price ignores the first rejection and runs above the current highs, the chart allows for a deeper manipulation towards 4,474.54.
🔺This would represent an ICT-style liquidity raid: price takes external buy-side liquidity, attracts breakout buyers, stops out early sellers and trades deeper into premium before reversing.
🔺A touch of 4,474.54 is not sufficient confirmation by itself. The setup requires rejection, bearish displacement and a lower-timeframe market structure shift after liquidity has been taken.
Confirmation-Based Execution
The preferred execution model is on the 15-minute or 1-hour timeframe:
🔺Allow price to enter 4,404–4,429, 4,430–4,445 or the deeper 4,474.54 liquidity level.
🔺Look for a sweep of a recent high or equal highs.
🔺Require bearish displacement through the nearest protected intraday low.
🔺Confirm a bearish CHOCH or MSS.
🔺Ideally, the displacement should leave a clean bearish FVG.
🔺Use the retracement into that FVG, bearish order block or breaker as the entry rather than chasing the initial move.
🔺Prioritise confirmation during the London or New York liquidity window.
If the price falls through 4,355–4,372 without first retracing into premium, the safer approach is to wait for the broken bullish order block to be retested as resistance. Selling after a large bearish expansion would result in a poor entry point.
Downside Objectives
Take Profit One: 4,277.58
This is the first major rebalance area marked on the chart. It is located near the origin of the later bullish displacement and represents the logical first objective once the bullish order block fails. Partial profit may be considered here while retaining reduced exposure towards the second target.
Second Profit Zone: 4,105.56
This is the larger external draw on liquidity. It aligns with:
🔺The previous range-high region.
🔺The multiple-wick-rejection area.
🔺The base of the August breakout.
🔺The origin of the major bullish imbalance.
A move into 4,105.56 would complete the broader bearish repricing projected by both paths on the chart.
Bearish Scenarios
Primary Scenario
🔺Price retraces into 4,404–4,429 or retests the 4,430–4,445 premium zone. Buy-side liquidity is depleted, a bearish displacement confirms an MSS and the price breaks the 4,355–4,372 bullish order block.
This would expose 4,277.58 first, followed by 4,105.56.
Secondary-Entry Scenario
🔺Price expands through the recent highs and raids liquidity at 4,474.54. A bearish displacement and MSS from that level would provide the higher-premium entry shown on the chart.
The downside objectives remain 4,277.58 and 4,105.56.
This is our comprehensive chart analysis. If you find it helpful and informative please let us know in the comments. We wish you a happy trading week and weekend. Good luck and trade safely!
The SetupsFX_ Team❤️
📌The failed fair value gap acted as an inversion signal and was followed by strong displacement through the 4,300 and 4,370 structure levels. The completed leg into the current highs was therefore structurally bullish.
📌However, the price location has now changed. At 4,391.50, gold is no longer trading in discount. It is positioned in the premium portion of the active 4H dealing range after a highly imbalanced rally. Price is now approaching stacked supply and buy-side liquidity, creating the conditions for distribution and bearish repricing provided lower-timeframe order flow confirms the reversal.
I📌mportantly, the 4H chart has not yet produced a fully confirmed bearish market structure shift. Therefore, this is a conditional short setup from premium, not a blind market sell.
Market Structure and Liquidity Narrative
The earlier sections of the chart repeatedly demonstrate the same institutional delivery:
🔺Liquidity forms around swing highs, equal lows or trendline liquidity.
🔺Price raids that liquidity.
🔺A CHOCH or market structure shift develops.
🔺Displacement then carries price towards the opposite side of the range.
The late-July rejection from approximately 3,960–4,000 was the most important recent example. Sell-side liquidity was collected before price reversed and broke several external highs.
The August expansion subsequently printed consecutive bullish BOS signals. The bullish order block around 4,355–4,372 and the earlier bullish-pressure zone around 4,302–4,324 remain important structural footprints from that move.
A decisive break below the 4,355–4,372 order block would be the first significant evidence that bullish delivery is failing. A subsequent retest of that broken order block as resistance could transform it into a bearish breaker and strengthen the downside thesis.
Premium Zones and Entry Models
The latest rally has delivered price into a premium array containing several layers of supply.
Near-term mitigation zone: 4,404–4,429
🔺This is the lower supply area used by the chart’s shorter projected path. A corrective bounce into this zone could mitigate newly created bearish supply before price begins moving towards the downside objectives.
First-entry zone: 4,430–4,445
🔺This is the primary premium selling zone marked on the chart. Price has already traded into this area and produced an initial rejection. Recent highs within and above the zone hold buy-side liquidity, meaning another test could first sweep stops before a bearish move develops.
Second-entry level: 4,474.54
🔺If price ignores the first rejection and runs above the current highs, the chart allows for a deeper manipulation towards 4,474.54.
🔺This would represent an ICT-style liquidity raid: price takes external buy-side liquidity, attracts breakout buyers, stops out early sellers and trades deeper into premium before reversing.
🔺A touch of 4,474.54 is not sufficient confirmation by itself. The setup requires rejection, bearish displacement and a lower-timeframe market structure shift after liquidity has been taken.
Confirmation-Based Execution
The preferred execution model is on the 15-minute or 1-hour timeframe:
🔺Allow price to enter 4,404–4,429, 4,430–4,445 or the deeper 4,474.54 liquidity level.
🔺Look for a sweep of a recent high or equal highs.
🔺Require bearish displacement through the nearest protected intraday low.
🔺Confirm a bearish CHOCH or MSS.
🔺Ideally, the displacement should leave a clean bearish FVG.
🔺Use the retracement into that FVG, bearish order block or breaker as the entry rather than chasing the initial move.
🔺Prioritise confirmation during the London or New York liquidity window.
If the price falls through 4,355–4,372 without first retracing into premium, the safer approach is to wait for the broken bullish order block to be retested as resistance. Selling after a large bearish expansion would result in a poor entry point.
Downside Objectives
Take Profit One: 4,277.58
This is the first major rebalance area marked on the chart. It is located near the origin of the later bullish displacement and represents the logical first objective once the bullish order block fails. Partial profit may be considered here while retaining reduced exposure towards the second target.
Second Profit Zone: 4,105.56
This is the larger external draw on liquidity. It aligns with:
🔺The previous range-high region.
🔺The multiple-wick-rejection area.
🔺The base of the August breakout.
🔺The origin of the major bullish imbalance.
A move into 4,105.56 would complete the broader bearish repricing projected by both paths on the chart.
Bearish Scenarios
Primary Scenario
🔺Price retraces into 4,404–4,429 or retests the 4,430–4,445 premium zone. Buy-side liquidity is depleted, a bearish displacement confirms an MSS and the price breaks the 4,355–4,372 bullish order block.
This would expose 4,277.58 first, followed by 4,105.56.
Secondary-Entry Scenario
🔺Price expands through the recent highs and raids liquidity at 4,474.54. A bearish displacement and MSS from that level would provide the higher-premium entry shown on the chart.
The downside objectives remain 4,277.58 and 4,105.56.
This is our comprehensive chart analysis. If you find it helpful and informative please let us know in the comments. We wish you a happy trading week and weekend. Good luck and trade safely!
The SetupsFX_ Team❤️
การซื้อขายยังคงดำเนินอยู่
+896 Pips From Our First Entry. 
Looking for intraday signals on Forex and XAUUSD (GOLD) with 98% Win Rate In Gold And 83% Win Rate In Forex!
Forex Bot: t.me/SetupsfxFOREX_Bot
Gold Bot: t.me/SetupsfxGOLD_Bot
Free Public Group: t.me/ssetupsfx_success
Forex Bot: t.me/SetupsfxFOREX_Bot
Gold Bot: t.me/SetupsfxGOLD_Bot
Free Public Group: t.me/ssetupsfx_success
คำจำกัดสิทธิ์ความรับผิดชอบ
ข้อมูลและบทความไม่ได้มีวัตถุประสงค์เพื่อก่อให้เกิดกิจกรรมทางการเงิน, การลงทุน, การซื้อขาย, ข้อเสนอแนะ หรือคำแนะนำประเภทอื่น ๆ ที่ให้หรือรับรองโดย TradingView อ่านเพิ่มเติมใน ข้อกำหนดการใช้งาน
Looking for intraday signals on Forex and XAUUSD (GOLD) with 98% Win Rate In Gold And 83% Win Rate In Forex!
Forex Bot: t.me/SetupsfxFOREX_Bot
Gold Bot: t.me/SetupsfxGOLD_Bot
Free Public Group: t.me/ssetupsfx_success
Forex Bot: t.me/SetupsfxFOREX_Bot
Gold Bot: t.me/SetupsfxGOLD_Bot
Free Public Group: t.me/ssetupsfx_success
คำจำกัดสิทธิ์ความรับผิดชอบ
ข้อมูลและบทความไม่ได้มีวัตถุประสงค์เพื่อก่อให้เกิดกิจกรรมทางการเงิน, การลงทุน, การซื้อขาย, ข้อเสนอแนะ หรือคำแนะนำประเภทอื่น ๆ ที่ให้หรือรับรองโดย TradingView อ่านเพิ่มเติมใน ข้อกำหนดการใช้งาน