
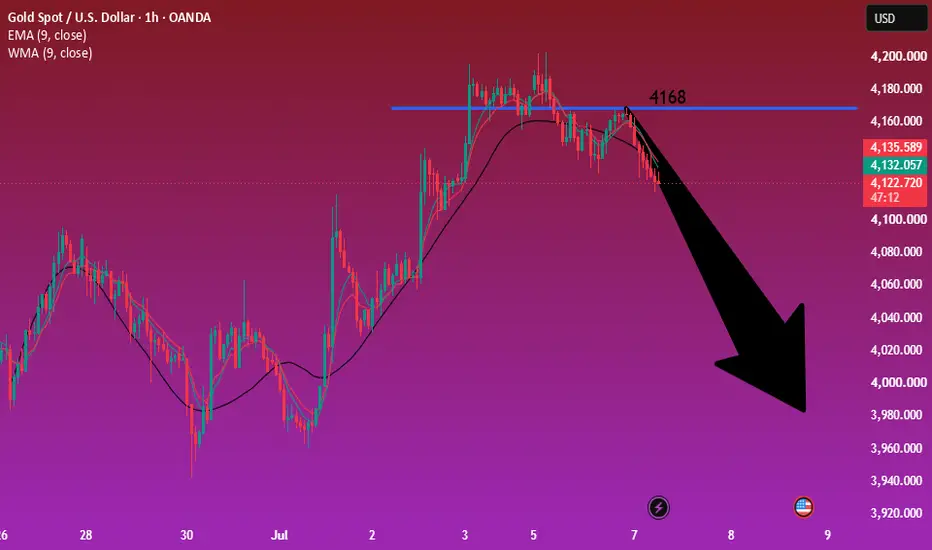
Gold Market Analysis:
Yesterday, gold entered a period of high-level consolidation, with significant resistance at 4203. This level also represents previous weekly resistance and moving average resistance, and the 30-day moving average on the daily chart is also approaching. Buying in began to result in a significant pullback, with gold falling directly to around 4128 yesterday, breaking the 4143 level. The short-term trend has entered a weak phase, with the daily candlestick closing bearish with a relatively long lower shadow, indicating the start of a correction period. This is the first sign of weakness after a continuous rebound. Today's strategy is to expect weak consolidation, with an overall bias towards selling. The target price is 4168; a break above this level would suggest a strong rebound. Recent fundamentals and geopolitical tensions have had a significant impact on gold. Gold is currently driven by technical factors, and short-term trading opportunities do not affect the overall wave structure.
In Asian trading, gold can be sold initially based on the resistance at 4168. If it breaks below 4125, consider selling again on a rebound. The previous support levels at 4111 and 4100 are significant; a break below these levels would essentially confirm the end of the rebound and the start of a new wave correction. The daily support for gold is also around 4125. Don't try to catch gold during the Asian session's weak correction.
Support: 4125 and strong support: 4100; Resistance: 4150 and 4168; 4168 is the key level for market strength/weakness.
Fundamental Analysis:
While the Middle East situation has been relatively calm recently, risks haven't been completely resolved. A US official stated that Iran fired at least two missiles at ships in the Strait of Hormuz. Two merchant ships were hit and severely damaged, but there were no casualties.
Trading Recommendation:
Gold – Sell around 4150, target 4120-4100.
Yesterday, gold entered a period of high-level consolidation, with significant resistance at 4203. This level also represents previous weekly resistance and moving average resistance, and the 30-day moving average on the daily chart is also approaching. Buying in began to result in a significant pullback, with gold falling directly to around 4128 yesterday, breaking the 4143 level. The short-term trend has entered a weak phase, with the daily candlestick closing bearish with a relatively long lower shadow, indicating the start of a correction period. This is the first sign of weakness after a continuous rebound. Today's strategy is to expect weak consolidation, with an overall bias towards selling. The target price is 4168; a break above this level would suggest a strong rebound. Recent fundamentals and geopolitical tensions have had a significant impact on gold. Gold is currently driven by technical factors, and short-term trading opportunities do not affect the overall wave structure.
In Asian trading, gold can be sold initially based on the resistance at 4168. If it breaks below 4125, consider selling again on a rebound. The previous support levels at 4111 and 4100 are significant; a break below these levels would essentially confirm the end of the rebound and the start of a new wave correction. The daily support for gold is also around 4125. Don't try to catch gold during the Asian session's weak correction.
Support: 4125 and strong support: 4100; Resistance: 4150 and 4168; 4168 is the key level for market strength/weakness.
Fundamental Analysis:
While the Middle East situation has been relatively calm recently, risks haven't been completely resolved. A US official stated that Iran fired at least two missiles at ships in the Strait of Hormuz. Two merchant ships were hit and severely damaged, but there were no casualties.
Trading Recommendation:
Gold – Sell around 4150, target 4120-4100.

คำจำกัดสิทธิ์ความรับผิดชอบ
ข้อมูลและบทความไม่ได้มีวัตถุประสงค์เพื่อก่อให้เกิดกิจกรรมทางการเงิน, การลงทุน, การซื้อขาย, ข้อเสนอแนะ หรือคำแนะนำประเภทอื่น ๆ ที่ให้หรือรับรองโดย TradingView อ่านเพิ่มเติมใน ข้อกำหนดการใช้งาน
คำจำกัดสิทธิ์ความรับผิดชอบ
ข้อมูลและบทความไม่ได้มีวัตถุประสงค์เพื่อก่อให้เกิดกิจกรรมทางการเงิน, การลงทุน, การซื้อขาย, ข้อเสนอแนะ หรือคำแนะนำประเภทอื่น ๆ ที่ให้หรือรับรองโดย TradingView อ่านเพิ่มเติมใน ข้อกำหนดการใช้งาน