
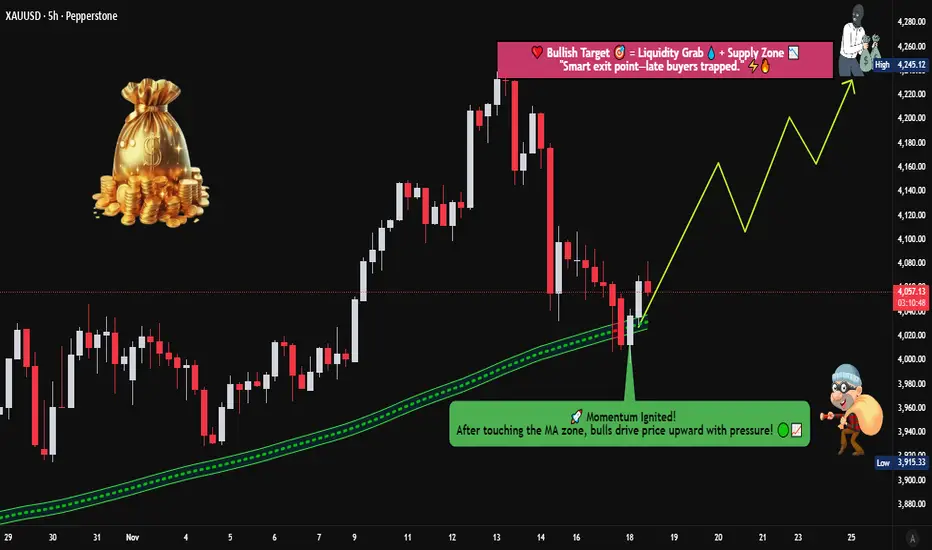
🏆 XAU/USD GOLD SWING TRADE OPPORTUNITY 💰
Bullish Pullback Setup | LSMA Moving Average Confirmation
📊 TRADE PLAN OVERVIEW
Asset: XAU/USD (Gold vs US Dollar) | METALS Market
Timeframe: Swing Trade (4H-Daily Bias)
Setup Type: Bullish Continuation on Pullback
Confirmation Indicator: LSMA Moving Average
🎯 ENTRY STRATEGY
Method: Layer Entry Using Multiple Buy Limit Orders (Recommended)
Entry Zones:
Primary Entry: 4010.00 - 4020.00 (First layer - 40% position)
Secondary Entry: 3990.00 - 4000.00 (Second layer - 35% position)
Confirmation: Wait for LSMA to show bullish crossover + price rejection from support level
🛑 RISK MANAGEMENT
Stop Loss: 3960.00
⚠️ Important Note: Adjust your SL based on YOUR personal risk tolerance & trading strategy. This is a suggested level only - YOUR risk management is YOUR responsibility.
Risk/Reward Ratio: 1:2.5 minimum recommended
🚀 PROFIT TARGET
Primary Target: 4260.00
Technical Reasons:
Strong resistance level identified
Overbought zone trap setup (scalp-friendly)
Correction potential after breakdown confirmation
Historical support/resistance confluence
⚠️ Disclaimer: Take partial profits at technical levels. TP is suggestive only - YOUR profit management is YOUR decision. Risk management is individual responsibility.
📈 TECHNICAL INDICATORS ANALYZED
✅ LSMA Moving Average - Bullish Structure Confirmation
✅ Price Action - Pullback to Support
✅ Resistance/Support Levels - Multi-timeframe confluence
✅ Overbought/Oversold Zones - Trap identification
🔗 CORRELATED PAIRS TO WATCH
1. EURUSD (EUR/USD) - Inverse Correlation ⚠️
Gold typically strengthens when USD weakens
If EURUSD rallies, XAU/USD may follow (USD weakness)
Key Point: Monitor US Dollar strength/weakness for directional bias
Setup Link: EUR strength = Gold strength
2. DXY (US Dollar Index) - Direct Inverse Correlation 📉
Most Important Correlation
When DXY falls → Gold typically rises
When DXY rises → Gold typically falls
Key Levels to Watch: DXY 105.50 - 106.50 (Major support/resistance)
Our Edge: If DXY breaks below support, XAU/USD bullish case strengthens
3. USDJPY (USD/JPY) - Strong USD Indicator 💹
High positive correlation with USD strength
If USDJPY rises sharply = USD strengthening = Gold pressure
Key Point: Monitor for conflicting signals before entry
Watch Zone: 150.00 - 151.50 resistance
4. SPX500 (S&P 500) - Risk Sentiment Indicator 📊
Risk-off environment = Gold strength
During market corrections, gold rallies (safe-haven)
Key Point: If SPX breaks major support, expect gold rally acceleration
Current Context: Monitor for equity weakness signals
5. UST10Y (US 10-Year Treasury Yield) - Rate Pressure 📉
Inverse relationship with Gold prices
Rising yields = Gold headwinds
Falling yields = Gold tailwinds
Our Setup: Lower yields support bullish gold bias
💡 PRE-TRADE CHECKLIST
Confirm LSMA bullish alignment on primary timeframe
Check DXY weakness (< 106.00 = favorable)
Verify no major economic data releases (next 4 hours)
Set layer entry limit orders (avoid FOMO market entries)
Confirm risk/reward = minimum 1:2.5
Position size = 1-2% account risk maximum
Set alerts at entry/SL/TP levels
⚡ TRADING RULES
ONLY enter on confirmed LSMA bullish structure
Use limit orders (never market buy at resistance)
Trail stop-loss once +50 pips profit locked
Take 50% profit at +100 pips minimum
Move remaining SL to breakeven + 5 pips after TP1 hit
Never add to losing position
Created For: Active Swing Traders | Technical Analysis Enthusiasts
Best Used: Combined with your own analysis & risk management
Updated: Real-time market conditions check recommended before entry
"The best trade is the one you DON'T take because it doesn't fit your plan."
Bullish Pullback Setup | LSMA Moving Average Confirmation
📊 TRADE PLAN OVERVIEW
Asset: XAU/USD (Gold vs US Dollar) | METALS Market
Timeframe: Swing Trade (4H-Daily Bias)
Setup Type: Bullish Continuation on Pullback
Confirmation Indicator: LSMA Moving Average
🎯 ENTRY STRATEGY
Method: Layer Entry Using Multiple Buy Limit Orders (Recommended)
Entry Zones:
Primary Entry: 4010.00 - 4020.00 (First layer - 40% position)
Secondary Entry: 3990.00 - 4000.00 (Second layer - 35% position)
Confirmation: Wait for LSMA to show bullish crossover + price rejection from support level
🛑 RISK MANAGEMENT
Stop Loss: 3960.00
⚠️ Important Note: Adjust your SL based on YOUR personal risk tolerance & trading strategy. This is a suggested level only - YOUR risk management is YOUR responsibility.
Risk/Reward Ratio: 1:2.5 minimum recommended
🚀 PROFIT TARGET
Primary Target: 4260.00
Technical Reasons:
Strong resistance level identified
Overbought zone trap setup (scalp-friendly)
Correction potential after breakdown confirmation
Historical support/resistance confluence
⚠️ Disclaimer: Take partial profits at technical levels. TP is suggestive only - YOUR profit management is YOUR decision. Risk management is individual responsibility.
📈 TECHNICAL INDICATORS ANALYZED
✅ LSMA Moving Average - Bullish Structure Confirmation
✅ Price Action - Pullback to Support
✅ Resistance/Support Levels - Multi-timeframe confluence
✅ Overbought/Oversold Zones - Trap identification
🔗 CORRELATED PAIRS TO WATCH
1. EURUSD (EUR/USD) - Inverse Correlation ⚠️
Gold typically strengthens when USD weakens
If EURUSD rallies, XAU/USD may follow (USD weakness)
Key Point: Monitor US Dollar strength/weakness for directional bias
Setup Link: EUR strength = Gold strength
2. DXY (US Dollar Index) - Direct Inverse Correlation 📉
Most Important Correlation
When DXY falls → Gold typically rises
When DXY rises → Gold typically falls
Key Levels to Watch: DXY 105.50 - 106.50 (Major support/resistance)
Our Edge: If DXY breaks below support, XAU/USD bullish case strengthens
3. USDJPY (USD/JPY) - Strong USD Indicator 💹
High positive correlation with USD strength
If USDJPY rises sharply = USD strengthening = Gold pressure
Key Point: Monitor for conflicting signals before entry
Watch Zone: 150.00 - 151.50 resistance
4. SPX500 (S&P 500) - Risk Sentiment Indicator 📊
Risk-off environment = Gold strength
During market corrections, gold rallies (safe-haven)
Key Point: If SPX breaks major support, expect gold rally acceleration
Current Context: Monitor for equity weakness signals
5. UST10Y (US 10-Year Treasury Yield) - Rate Pressure 📉
Inverse relationship with Gold prices
Rising yields = Gold headwinds
Falling yields = Gold tailwinds
Our Setup: Lower yields support bullish gold bias
💡 PRE-TRADE CHECKLIST
Confirm LSMA bullish alignment on primary timeframe
Check DXY weakness (< 106.00 = favorable)
Verify no major economic data releases (next 4 hours)
Set layer entry limit orders (avoid FOMO market entries)
Confirm risk/reward = minimum 1:2.5
Position size = 1-2% account risk maximum
Set alerts at entry/SL/TP levels
⚡ TRADING RULES
ONLY enter on confirmed LSMA bullish structure
Use limit orders (never market buy at resistance)
Trail stop-loss once +50 pips profit locked
Take 50% profit at +100 pips minimum
Move remaining SL to breakeven + 5 pips after TP1 hit
Never add to losing position
Created For: Active Swing Traders | Technical Analysis Enthusiasts
Best Used: Combined with your own analysis & risk management
Updated: Real-time market conditions check recommended before entry
"The best trade is the one you DON'T take because it doesn't fit your plan."
การซื้อขายยังคงดำเนินอยู่
ปิดการเทรด: ถึงเป้าหมายการทำกำไร

การนำเสนอที่เกี่ยวข้อง
คำจำกัดสิทธิ์ความรับผิดชอบ
ข้อมูลและบทความไม่ได้มีวัตถุประสงค์เพื่อก่อให้เกิดกิจกรรมทางการเงิน, การลงทุน, การซื้อขาย, ข้อเสนอแนะ หรือคำแนะนำประเภทอื่น ๆ ที่ให้หรือรับรองโดย TradingView อ่านเพิ่มเติมใน ข้อกำหนดการใช้งาน
การนำเสนอที่เกี่ยวข้อง
คำจำกัดสิทธิ์ความรับผิดชอบ
ข้อมูลและบทความไม่ได้มีวัตถุประสงค์เพื่อก่อให้เกิดกิจกรรมทางการเงิน, การลงทุน, การซื้อขาย, ข้อเสนอแนะ หรือคำแนะนำประเภทอื่น ๆ ที่ให้หรือรับรองโดย TradingView อ่านเพิ่มเติมใน ข้อกำหนดการใช้งาน