
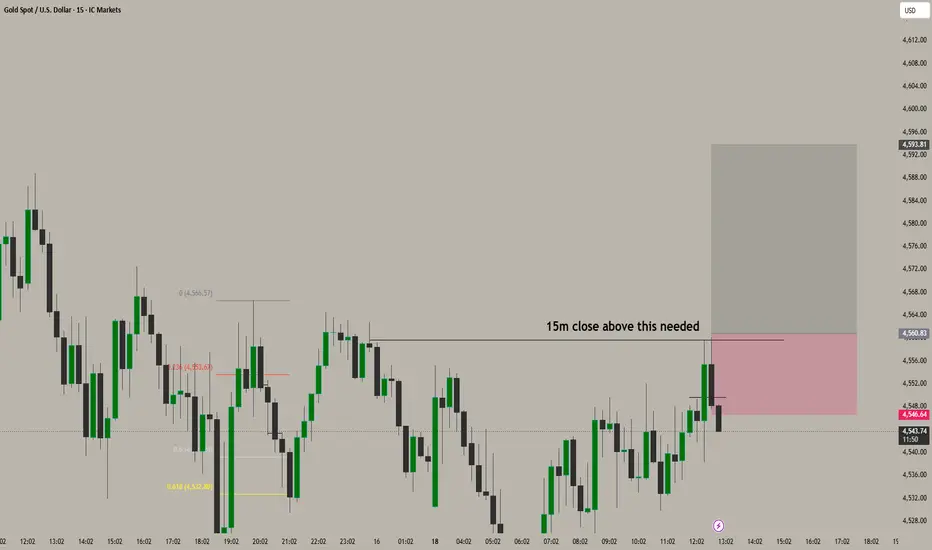
1. Current Context
XAU/USD is sensitive to USD strength, interest rates, and risk sentiment.
Recent behavior: If Gold has been consolidating near a support zone or showing bullish reversal candlestick patterns, that may hint at a buy setup.
2. Support/Resistance Levels
Support: Look for strong historical zones where price reversed (e.g., $1,950–$1,960 if testing recent lows).
Resistance: Identify the nearest supply zone (~$2,000–$2,020). This is where profit-taking could occur.
3. Technical Indicators (for buy confirmation)
Moving Averages: Price above 50/100 EMA on the 4H or daily chart can indicate bullish bias.
RSI: If RSI is rising from 40–50, it suggests momentum is picking up without being overbought.
MACD: Look for bullish crossover below the zero line (momentum turning upward).
4. Entry / Stop / Target
Entry: Near strong support zone or after a confirmed bullish candlestick pattern (e.g., engulfing or hammer).
Stop Loss: Below key support (e.g., $1,945 if $1,950 is the support zone).
Target: Near the next resistance level (~$2,000–$2,020). Adjust if momentum is strong.
5. Risk Management
Risk 1–2% of account per trade.
Check correlation with USD Index (DXY) and equities. A sudden USD rally may invalidate the trade.
XAU/USD is sensitive to USD strength, interest rates, and risk sentiment.
Recent behavior: If Gold has been consolidating near a support zone or showing bullish reversal candlestick patterns, that may hint at a buy setup.
2. Support/Resistance Levels
Support: Look for strong historical zones where price reversed (e.g., $1,950–$1,960 if testing recent lows).
Resistance: Identify the nearest supply zone (~$2,000–$2,020). This is where profit-taking could occur.
3. Technical Indicators (for buy confirmation)
Moving Averages: Price above 50/100 EMA on the 4H or daily chart can indicate bullish bias.
RSI: If RSI is rising from 40–50, it suggests momentum is picking up without being overbought.
MACD: Look for bullish crossover below the zero line (momentum turning upward).
4. Entry / Stop / Target
Entry: Near strong support zone or after a confirmed bullish candlestick pattern (e.g., engulfing or hammer).
Stop Loss: Below key support (e.g., $1,945 if $1,950 is the support zone).
Target: Near the next resistance level (~$2,000–$2,020). Adjust if momentum is strong.
5. Risk Management
Risk 1–2% of account per trade.
Check correlation with USD Index (DXY) and equities. A sudden USD rally may invalidate the trade.

คำจำกัดสิทธิ์ความรับผิดชอบ
ข้อมูลและบทความไม่ได้มีวัตถุประสงค์เพื่อก่อให้เกิดกิจกรรมทางการเงิน, การลงทุน, การซื้อขาย, ข้อเสนอแนะ หรือคำแนะนำประเภทอื่น ๆ ที่ให้หรือรับรองโดย TradingView อ่านเพิ่มเติมใน ข้อกำหนดการใช้งาน
คำจำกัดสิทธิ์ความรับผิดชอบ
ข้อมูลและบทความไม่ได้มีวัตถุประสงค์เพื่อก่อให้เกิดกิจกรรมทางการเงิน, การลงทุน, การซื้อขาย, ข้อเสนอแนะ หรือคำแนะนำประเภทอื่น ๆ ที่ให้หรือรับรองโดย TradingView อ่านเพิ่มเติมใน ข้อกำหนดการใช้งาน