
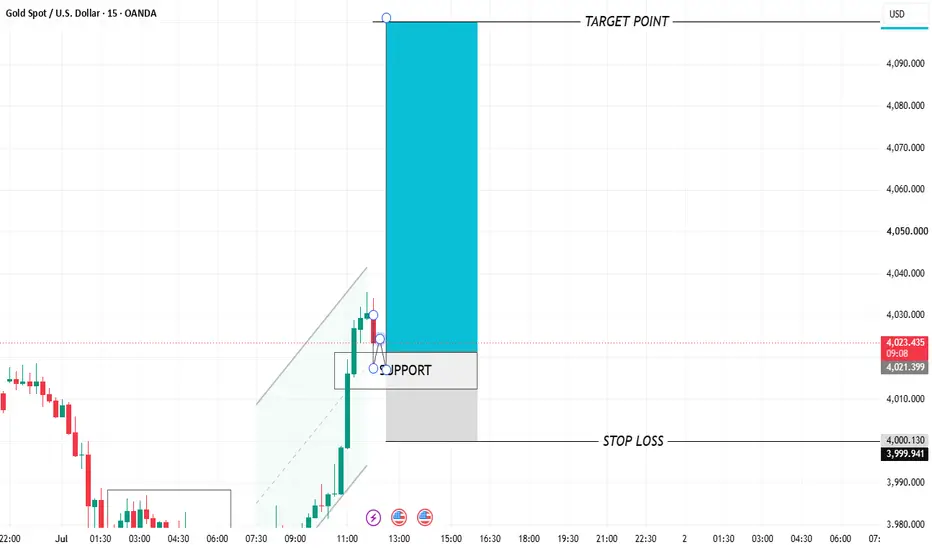
XAUUSD (Gold) 15-Minute Technical Analysis
The chart shows strong bullish momentum after an impulsive breakout from the intraday uptrend channel. Price has rallied aggressively into the 4,030 resistance area, where buying pressure is beginning to slow.
Market Structure
Trend: Bullish (Higher Highs & Higher Lows)
Momentum: Strong, but currently extended after the sharp rally.
Bias: Bullish continuation as long as the highlighted support zone holds.
Key Levels
Immediate Resistance: 4,030–4,035 (current price area)
Support Zone: 4,011–4,022 (highlighted demand/retest area)
Stop-Loss Zone: Below 4,000
Trade Scenario
The chart suggests waiting for a healthy pullback into the highlighted support zone rather than chasing price higher.
Bullish Confirmation
Price retraces into 4,011–4,022.
Buyers defend the zone with bullish rejection candles or strong bullish engulfing confirmation.
Continuation above 4,030 opens the path toward the projected upside target.
Invalidation
A decisive 15-minute candle closing below 4,000 would invalidate the bullish setup and increase the probability of a deeper correction.
Outlook
The overall trend remains bullish, but price is trading after an impulsive move, making a pullback more likely before another leg higher. Patience for a retest of support offers a better risk-to-reward opportunity than entering at current highs.
Educational Note: This analysis is for educational purposes only and should be combined with confirmation from price action and proper risk management before taking any trade.
The chart shows strong bullish momentum after an impulsive breakout from the intraday uptrend channel. Price has rallied aggressively into the 4,030 resistance area, where buying pressure is beginning to slow.
Market Structure
Trend: Bullish (Higher Highs & Higher Lows)
Momentum: Strong, but currently extended after the sharp rally.
Bias: Bullish continuation as long as the highlighted support zone holds.
Key Levels
Immediate Resistance: 4,030–4,035 (current price area)
Support Zone: 4,011–4,022 (highlighted demand/retest area)
Stop-Loss Zone: Below 4,000
Trade Scenario
The chart suggests waiting for a healthy pullback into the highlighted support zone rather than chasing price higher.
Bullish Confirmation
Price retraces into 4,011–4,022.
Buyers defend the zone with bullish rejection candles or strong bullish engulfing confirmation.
Continuation above 4,030 opens the path toward the projected upside target.
Invalidation
A decisive 15-minute candle closing below 4,000 would invalidate the bullish setup and increase the probability of a deeper correction.
Outlook
The overall trend remains bullish, but price is trading after an impulsive move, making a pullback more likely before another leg higher. Patience for a retest of support offers a better risk-to-reward opportunity than entering at current highs.
Educational Note: This analysis is for educational purposes only and should be combined with confirmation from price action and proper risk management before taking any trade.
ปิดการเทรด: ถึงเป้าหมายการทำกำไร
บันทึก
target hitt
JOIN MY TELEGRAM CHANNEL LINK t.me/lmindgolde JOIN MY TELEGRAM CHANNEL LINK t.me/lmindgolde
คำจำกัดสิทธิ์ความรับผิดชอบ
ข้อมูลและบทความไม่ได้มีวัตถุประสงค์เพื่อก่อให้เกิดกิจกรรมทางการเงิน, การลงทุน, การซื้อขาย, ข้อเสนอแนะ หรือคำแนะนำประเภทอื่น ๆ ที่ให้หรือรับรองโดย TradingView อ่านเพิ่มเติมใน ข้อกำหนดการใช้งาน
JOIN MY TELEGRAM CHANNEL LINK t.me/lmindgolde JOIN MY TELEGRAM CHANNEL LINK t.me/lmindgolde
คำจำกัดสิทธิ์ความรับผิดชอบ
ข้อมูลและบทความไม่ได้มีวัตถุประสงค์เพื่อก่อให้เกิดกิจกรรมทางการเงิน, การลงทุน, การซื้อขาย, ข้อเสนอแนะ หรือคำแนะนำประเภทอื่น ๆ ที่ให้หรือรับรองโดย TradingView อ่านเพิ่มเติมใน ข้อกำหนดการใช้งาน