
XAUUSD Analysis: Elliott Wave Structure Confirms Bearish Momentum – Target 4351
Gold is weakening clearly in the short term as selling pressure returns and pushes price below the 4630 area. From a technical perspective, this no longer looks like a minor pullback. It is starting to resemble a continuation structure, with the near-term support zone beginning to lose its effect.
Technical structure
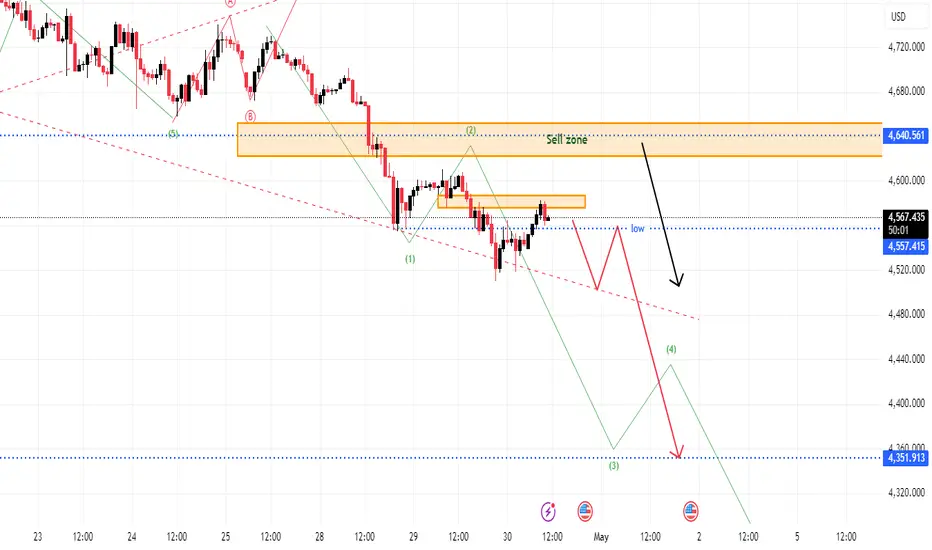
On the chart, price has slipped below the recent reaction zone and is now testing the Sell Zone 4640 from a weaker position. What stands out is that the market has not been able to produce a strong enough rebound from this area, while every recovery attempt remains shallow and quickly gets sold into.
The current structure matters for three reasons:
Price is breaking down through the 4640 resistance area.
The nearby 4557 pivot low is becoming the next important downside reference.
The broader structure still leaves room for a deeper move towards 4351.
Key levels to watch:
4640: Former support zone, now the level price would need to reclaim.
4557: Nearest strong support (Wave 3 trigger point).
4351: Deeper support if downside momentum expands (Major liquidity target).
Elliott Wave view
From an Elliott Wave perspective, Gold is beginning to show signs of entering a new bearish cycle, with the current decline looking more impulsive than the recent rebounds. After completing the previous short-term recovery, the market now appears to be developing the early stages of a fresh downside structure.
Specifically, the wave breakdown suggests:
Waves (1) and (2) have completed at the 4640 zone, establishing a lower high.
The market is now unfolding Wave (3)—the most powerful leg of an impulse move—aiming for lower extensions.
That matters because once price leaves the rebound zone and starts breaking support, the market is no longer being judged as a recovery chart. It starts shifting into a confirmation phase for the next bearish cycle.
Fibonacci and liquidity structure
Structurally, 4557 is now the nearest liquidity zone that price may be drawn towards if selling pressure continues. If that level fails to hold, then 4351 becomes the deeper technical objective in today’s bearish scenario and possibly beyond.
When near-term support breaks while the larger wave structure is turning lower, the market often starts rotating towards lower liquidity clusters at the base of the descending channel.
What matters next
If Gold remains below 4640 and cannot close back above it, then today’s bearish scenario remains active. In that case, the market may continue pressing towards 4557 first.
If 4557 breaks with clear momentum, the bearish structure would expand further and the next downside reference would be 4351.
On the other hand, if price quickly reclaims 4640 and holds above it, then the immediate bearish pressure would ease and the chart may need a more neutral reassessment.
Conclusion
Gold is weakening in the short term, and the current structure is leaning clearly towards a bearish scenario. The loss of the 4640 zone suggests buyers are losing control, while sellers are beginning to regain momentum within the descending channel.
Unless price can reclaim the broken support area, the market may continue lower towards 4557, and potentially 4351 if bearish pressure expands.
The downside move is already in play.
And structurally, the market is still showing room for more weakness.
Disclaimer: This analysis is for educational purposes only and does not constitute financial advice.
Gold is weakening clearly in the short term as selling pressure returns and pushes price below the 4630 area. From a technical perspective, this no longer looks like a minor pullback. It is starting to resemble a continuation structure, with the near-term support zone beginning to lose its effect.
Technical structure
On the chart, price has slipped below the recent reaction zone and is now testing the Sell Zone 4640 from a weaker position. What stands out is that the market has not been able to produce a strong enough rebound from this area, while every recovery attempt remains shallow and quickly gets sold into.
The current structure matters for three reasons:
Price is breaking down through the 4640 resistance area.
The nearby 4557 pivot low is becoming the next important downside reference.
The broader structure still leaves room for a deeper move towards 4351.
Key levels to watch:
4640: Former support zone, now the level price would need to reclaim.
4557: Nearest strong support (Wave 3 trigger point).
4351: Deeper support if downside momentum expands (Major liquidity target).
Elliott Wave view
From an Elliott Wave perspective, Gold is beginning to show signs of entering a new bearish cycle, with the current decline looking more impulsive than the recent rebounds. After completing the previous short-term recovery, the market now appears to be developing the early stages of a fresh downside structure.
Specifically, the wave breakdown suggests:
Waves (1) and (2) have completed at the 4640 zone, establishing a lower high.
The market is now unfolding Wave (3)—the most powerful leg of an impulse move—aiming for lower extensions.
That matters because once price leaves the rebound zone and starts breaking support, the market is no longer being judged as a recovery chart. It starts shifting into a confirmation phase for the next bearish cycle.
Fibonacci and liquidity structure
Structurally, 4557 is now the nearest liquidity zone that price may be drawn towards if selling pressure continues. If that level fails to hold, then 4351 becomes the deeper technical objective in today’s bearish scenario and possibly beyond.
When near-term support breaks while the larger wave structure is turning lower, the market often starts rotating towards lower liquidity clusters at the base of the descending channel.
What matters next
If Gold remains below 4640 and cannot close back above it, then today’s bearish scenario remains active. In that case, the market may continue pressing towards 4557 first.
If 4557 breaks with clear momentum, the bearish structure would expand further and the next downside reference would be 4351.
On the other hand, if price quickly reclaims 4640 and holds above it, then the immediate bearish pressure would ease and the chart may need a more neutral reassessment.
Conclusion
Gold is weakening in the short term, and the current structure is leaning clearly towards a bearish scenario. The loss of the 4640 zone suggests buyers are losing control, while sellers are beginning to regain momentum within the descending channel.
Unless price can reclaim the broken support area, the market may continue lower towards 4557, and potentially 4351 if bearish pressure expands.
The downside move is already in play.
And structurally, the market is still showing room for more weakness.
Disclaimer: This analysis is for educational purposes only and does not constitute financial advice.

📌 New analysis published daily
🔔 Follow this profile for real-time updates
⚠️ This is personal analysis, not financial advice
Daily GOLD and Forex updates: t.me/+SOSI26CZOJ1mZDhl
🔔 Follow this profile for real-time updates
⚠️ This is personal analysis, not financial advice
Daily GOLD and Forex updates: t.me/+SOSI26CZOJ1mZDhl
การนำเสนอที่เกี่ยวข้อง
คำจำกัดสิทธิ์ความรับผิดชอบ
ข้อมูลและบทความไม่ได้มีวัตถุประสงค์เพื่อก่อให้เกิดกิจกรรมทางการเงิน, การลงทุน, การซื้อขาย, ข้อเสนอแนะ หรือคำแนะนำประเภทอื่น ๆ ที่ให้หรือรับรองโดย TradingView อ่านเพิ่มเติมใน ข้อกำหนดการใช้งาน
📌 New analysis published daily
🔔 Follow this profile for real-time updates
⚠️ This is personal analysis, not financial advice
Daily GOLD and Forex updates: t.me/+SOSI26CZOJ1mZDhl
🔔 Follow this profile for real-time updates
⚠️ This is personal analysis, not financial advice
Daily GOLD and Forex updates: t.me/+SOSI26CZOJ1mZDhl
การนำเสนอที่เกี่ยวข้อง
คำจำกัดสิทธิ์ความรับผิดชอบ
ข้อมูลและบทความไม่ได้มีวัตถุประสงค์เพื่อก่อให้เกิดกิจกรรมทางการเงิน, การลงทุน, การซื้อขาย, ข้อเสนอแนะ หรือคำแนะนำประเภทอื่น ๆ ที่ให้หรือรับรองโดย TradingView อ่านเพิ่มเติมใน ข้อกำหนดการใช้งาน