
XAUUSD – H1 Technical Outlook: Extension Risk Near Highs as Geopolitical Tension Builds | Lana ✨
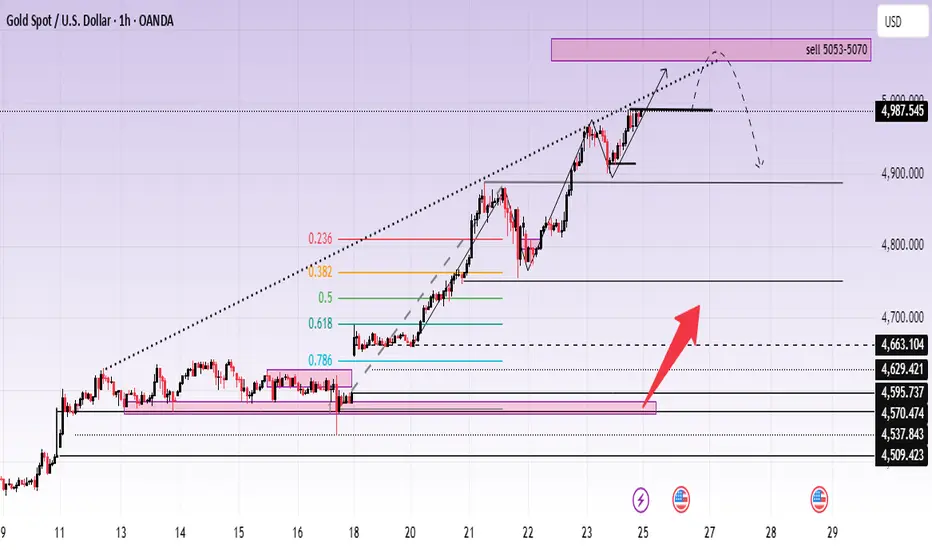
Gold continues to trade in a strong bullish structure, with price pushing higher along an ascending trendline. However, as the market approaches upper resistance zones, price action suggests the rally may be entering a more sensitive phase, where extension risk and volatility increase.
📈 Market Structure & Price Action
The short-term trend remains bullish, with price respecting the rising trendline.
Recent price action shows strong impulsive buying, followed by shallow pullbacks — a sign of aggressive demand.
However, price is now trading near the upper boundary of the trend channel, where upside continuation often becomes less efficient and more reactive.
The current structure favors continuation, but risk increases as price stretches further from value.
🔍 Key Technical Zones on H1
Immediate resistance / reaction zone: 4987 – 5000
This area represents a short-term ceiling where price may hesitate or form a temporary consolidation.
Sell zone (extension area): 5053 – 5070
A premium zone where upside becomes increasingly extended and profit-taking or corrective reactions are more likely.
Key support & value zones below:
4663 – 4629 (prior acceptance + structural support)
4595 – 4570 (deeper value area aligned with Fibonacci retracement)
These lower zones remain important reference points if price transitions from extension into correction.
🎯 Trading Scenarios
Primary scenario (bullish continuation):
If price consolidates above 4987 and accepts higher, the market may extend into the 5053–5070 zone. Any move into this area should be monitored closely for exhaustion signals rather than late breakout chasing.
Alternative scenario (pullback into structure):
Failure to hold above 4987–5000 could trigger a corrective move back toward 4663–4629, where buyers may look to re-engage at better value.
Lana prefers waiting for reactions at key zones, not chasing price when it is already extended.
🌍 Geopolitical Context (Why Volatility Matters Now)
Recent reports indicate that the USS Abraham Lincoln carrier strike group has entered the Indian Ocean, with expectations of moving toward the Arabian Sea in the coming days. The increased U.S. military presence in the Middle East, amid concerns of potential escalation involving Iran, adds a layer of geopolitical uncertainty.
Historically, such developments tend to:
Increase short-term volatility in gold
Support gold as a hedge, while also triggering sharp profit-taking swings
This backdrop reinforces the importance of risk management and patience, especially when price is trading near premium zones.
🧠 Lana’s Perspective
Gold remains bullish, but not every bullish phase is a good place to buy.
As price trades higher into premium and extension zones, Lana focuses on structure, value, and reaction, not emotional momentum.
✨ Respect the trend, manage extension risk, and let price come to your levels.
Gold continues to trade in a strong bullish structure, with price pushing higher along an ascending trendline. However, as the market approaches upper resistance zones, price action suggests the rally may be entering a more sensitive phase, where extension risk and volatility increase.
📈 Market Structure & Price Action
The short-term trend remains bullish, with price respecting the rising trendline.
Recent price action shows strong impulsive buying, followed by shallow pullbacks — a sign of aggressive demand.
However, price is now trading near the upper boundary of the trend channel, where upside continuation often becomes less efficient and more reactive.
The current structure favors continuation, but risk increases as price stretches further from value.
🔍 Key Technical Zones on H1
Immediate resistance / reaction zone: 4987 – 5000
This area represents a short-term ceiling where price may hesitate or form a temporary consolidation.
Sell zone (extension area): 5053 – 5070
A premium zone where upside becomes increasingly extended and profit-taking or corrective reactions are more likely.
Key support & value zones below:
4663 – 4629 (prior acceptance + structural support)
4595 – 4570 (deeper value area aligned with Fibonacci retracement)
These lower zones remain important reference points if price transitions from extension into correction.
🎯 Trading Scenarios
Primary scenario (bullish continuation):
If price consolidates above 4987 and accepts higher, the market may extend into the 5053–5070 zone. Any move into this area should be monitored closely for exhaustion signals rather than late breakout chasing.
Alternative scenario (pullback into structure):
Failure to hold above 4987–5000 could trigger a corrective move back toward 4663–4629, where buyers may look to re-engage at better value.
Lana prefers waiting for reactions at key zones, not chasing price when it is already extended.
🌍 Geopolitical Context (Why Volatility Matters Now)
Recent reports indicate that the USS Abraham Lincoln carrier strike group has entered the Indian Ocean, with expectations of moving toward the Arabian Sea in the coming days. The increased U.S. military presence in the Middle East, amid concerns of potential escalation involving Iran, adds a layer of geopolitical uncertainty.
Historically, such developments tend to:
Increase short-term volatility in gold
Support gold as a hedge, while also triggering sharp profit-taking swings
This backdrop reinforces the importance of risk management and patience, especially when price is trading near premium zones.
🧠 Lana’s Perspective
Gold remains bullish, but not every bullish phase is a good place to buy.
As price trades higher into premium and extension zones, Lana focuses on structure, value, and reaction, not emotional momentum.
✨ Respect the trend, manage extension risk, and let price come to your levels.

การนำเสนอที่เกี่ยวข้อง
คำจำกัดสิทธิ์ความรับผิดชอบ
ข้อมูลและบทความไม่ได้มีวัตถุประสงค์เพื่อก่อให้เกิดกิจกรรมทางการเงิน, การลงทุน, การซื้อขาย, ข้อเสนอแนะ หรือคำแนะนำประเภทอื่น ๆ ที่ให้หรือรับรองโดย TradingView อ่านเพิ่มเติมใน ข้อกำหนดการใช้งาน
การนำเสนอที่เกี่ยวข้อง
คำจำกัดสิทธิ์ความรับผิดชอบ
ข้อมูลและบทความไม่ได้มีวัตถุประสงค์เพื่อก่อให้เกิดกิจกรรมทางการเงิน, การลงทุน, การซื้อขาย, ข้อเสนอแนะ หรือคำแนะนำประเภทอื่น ๆ ที่ให้หรือรับรองโดย TradingView อ่านเพิ่มเติมใน ข้อกำหนดการใช้งาน