
🧹 XAUUSD Liquidity Sweep: Why a Wick Below Support Is NOT a Breakdown 📈
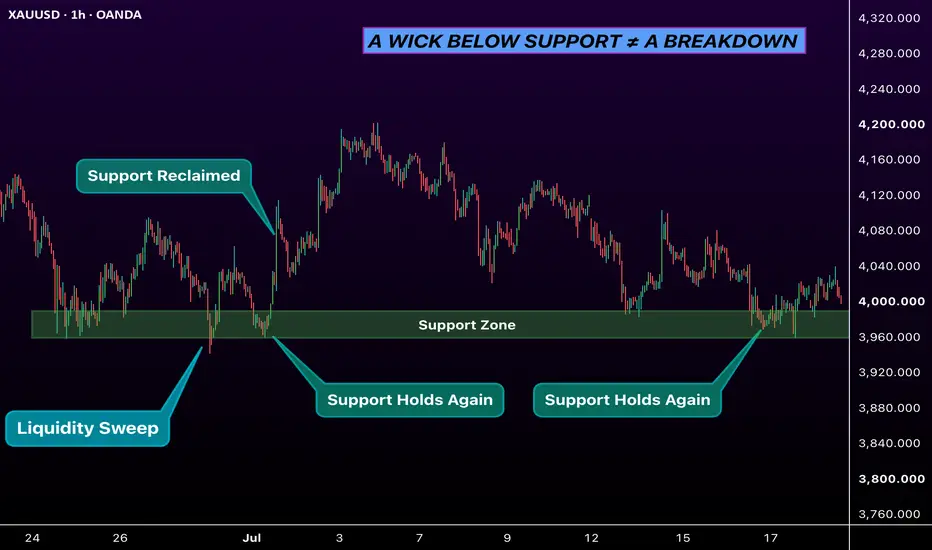
Price traded below the 3,960 support level, but sellers failed to hold the market underneath it. Instead, XAUUSD quickly reclaimed the level and moved higher. 👀
This is an important distinction:
🔻 A wick below support shows that price briefly traded below the level.
✅ A confirmed breakdown requires acceptance below support, preferably with candle closes and a failed retest from underneath.
In this example, the sequence was clear:
🧹 Liquidity sweep — price moved below the previous lows and triggered resting stops.
🔄 Support reclaimed — the candle returned above the level, showing rejection of lower prices.
🛡️ Support held again — the same area produced another reaction later, confirming that traders were still defending the zone.
The key lesson: do not treat every wick below support as a bearish breakout.
Before entering a short position, look for:
📍 A candle close below support
📍 Continued trading below the level
📍 A retest that turns support into resistance
📍 Bearish market structure and follow-through
Without those confirmations, the move may simply be a liquidity grab before price reverses. ⚠️
A wick shows where price travelled. A close shows where the market accepted value.
What do you see here? 🤔
1️⃣ Confirmed breakdown
2️⃣ Liquidity sweep
3️⃣ No trade without confirmation
Share your answer in the comments. 👇
Price traded below the 3,960 support level, but sellers failed to hold the market underneath it. Instead, XAUUSD quickly reclaimed the level and moved higher. 👀
This is an important distinction:
🔻 A wick below support shows that price briefly traded below the level.
✅ A confirmed breakdown requires acceptance below support, preferably with candle closes and a failed retest from underneath.
In this example, the sequence was clear:
🧹 Liquidity sweep — price moved below the previous lows and triggered resting stops.
🔄 Support reclaimed — the candle returned above the level, showing rejection of lower prices.
🛡️ Support held again — the same area produced another reaction later, confirming that traders were still defending the zone.
The key lesson: do not treat every wick below support as a bearish breakout.
Before entering a short position, look for:
📍 A candle close below support
📍 Continued trading below the level
📍 A retest that turns support into resistance
📍 Bearish market structure and follow-through
Without those confirmations, the move may simply be a liquidity grab before price reverses. ⚠️
A wick shows where price travelled. A close shows where the market accepted value.
What do you see here? 🤔
1️⃣ Confirmed breakdown
2️⃣ Liquidity sweep
3️⃣ No trade without confirmation
Share your answer in the comments. 👇

📊 Follow for daily Market Summary, Technical & Fundamental Analysis
👉 t.me/elibrianalytics
👉 t.me/elibrianalytics
คำจำกัดสิทธิ์ความรับผิดชอบ
ข้อมูลและบทความไม่ได้มีวัตถุประสงค์เพื่อก่อให้เกิดกิจกรรมทางการเงิน, การลงทุน, การซื้อขาย, ข้อเสนอแนะ หรือคำแนะนำประเภทอื่น ๆ ที่ให้หรือรับรองโดย TradingView อ่านเพิ่มเติมใน ข้อกำหนดการใช้งาน
📊 Follow for daily Market Summary, Technical & Fundamental Analysis
👉 t.me/elibrianalytics
👉 t.me/elibrianalytics
คำจำกัดสิทธิ์ความรับผิดชอบ
ข้อมูลและบทความไม่ได้มีวัตถุประสงค์เพื่อก่อให้เกิดกิจกรรมทางการเงิน, การลงทุน, การซื้อขาย, ข้อเสนอแนะ หรือคำแนะนำประเภทอื่น ๆ ที่ให้หรือรับรองโดย TradingView อ่านเพิ่มเติมใน ข้อกำหนดการใช้งาน