
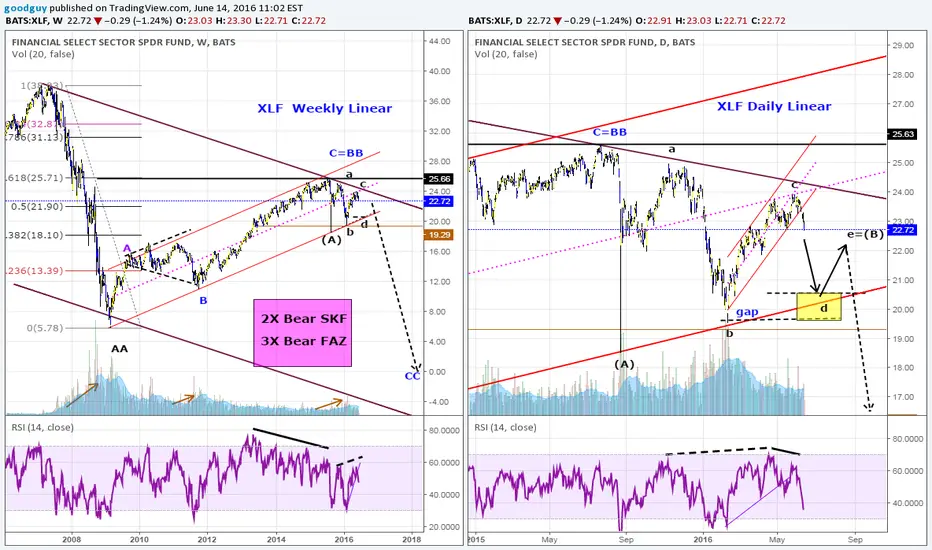
2 months ago I posted on XLF suggesting the top was likely in (see link below). As I review the recent price action I think it is is mostly likely forming a triangle before a final major drop. My intermediate term target is on the daily chart. I don't know if it will stop at the long term uptrend line or go on to close the gap. Take care. Good trading to you.
PS: Notice the nice channels. Also there is a negative reversal in the daily RSI followed by a bearish divergence which I have pointed out before often leads to lower lows.
PS: Notice the nice channels. Also there is a negative reversal in the daily RSI followed by a bearish divergence which I have pointed out before often leads to lower lows.

การนำเสนอที่เกี่ยวข้อง
คำจำกัดสิทธิ์ความรับผิดชอบ
ข้อมูลและบทความไม่ได้มีวัตถุประสงค์เพื่อก่อให้เกิดกิจกรรมทางการเงิน, การลงทุน, การซื้อขาย, ข้อเสนอแนะ หรือคำแนะนำประเภทอื่น ๆ ที่ให้หรือรับรองโดย TradingView อ่านเพิ่มเติมใน ข้อกำหนดการใช้งาน
การนำเสนอที่เกี่ยวข้อง
คำจำกัดสิทธิ์ความรับผิดชอบ
ข้อมูลและบทความไม่ได้มีวัตถุประสงค์เพื่อก่อให้เกิดกิจกรรมทางการเงิน, การลงทุน, การซื้อขาย, ข้อเสนอแนะ หรือคำแนะนำประเภทอื่น ๆ ที่ให้หรือรับรองโดย TradingView อ่านเพิ่มเติมใน ข้อกำหนดการใช้งาน