
Hello guys,
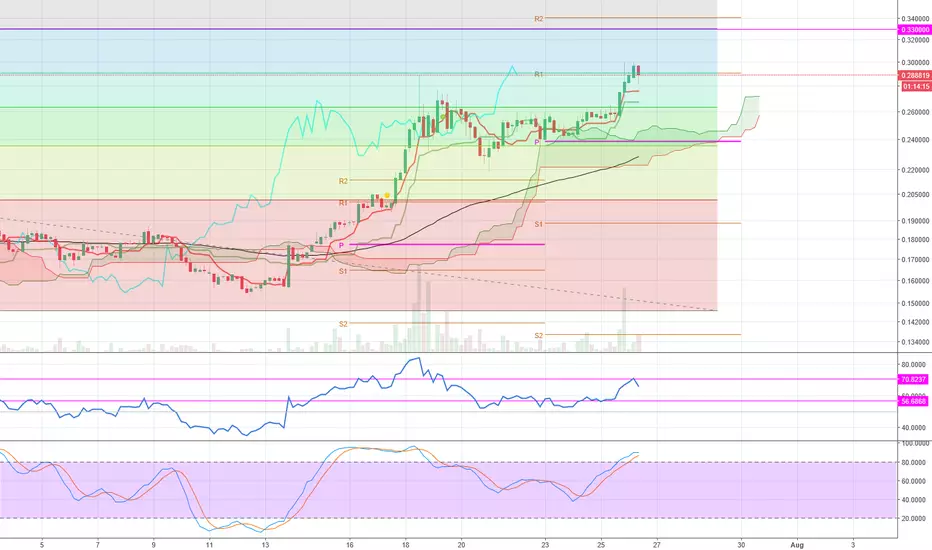
XLM Chart :
- We hit R1 weekly on H4 chart
- Little pullback on the RSI (21) 70%
- We need to have a signal from a bullish candlestick + break 70% rsi to have a bullish Momentum to go to the weekly R2 and next fibonacci level (0.33€) for a take profit !
Be patient, we need to have a new bullish signal for the next take profit !
XLM Chart :
- We hit R1 weekly on H4 chart
- Little pullback on the RSI (21) 70%
- We need to have a signal from a bullish candlestick + break 70% rsi to have a bullish Momentum to go to the weekly R2 and next fibonacci level (0.33€) for a take profit !
Be patient, we need to have a new bullish signal for the next take profit !

คำจำกัดสิทธิ์ความรับผิดชอบ
ข้อมูลและบทความไม่ได้มีวัตถุประสงค์เพื่อก่อให้เกิดกิจกรรมทางการเงิน, การลงทุน, การซื้อขาย, ข้อเสนอแนะ หรือคำแนะนำประเภทอื่น ๆ ที่ให้หรือรับรองโดย TradingView อ่านเพิ่มเติมใน ข้อกำหนดการใช้งาน
คำจำกัดสิทธิ์ความรับผิดชอบ
ข้อมูลและบทความไม่ได้มีวัตถุประสงค์เพื่อก่อให้เกิดกิจกรรมทางการเงิน, การลงทุน, การซื้อขาย, ข้อเสนอแนะ หรือคำแนะนำประเภทอื่น ๆ ที่ให้หรือรับรองโดย TradingView อ่านเพิ่มเติมใน ข้อกำหนดการใช้งาน