
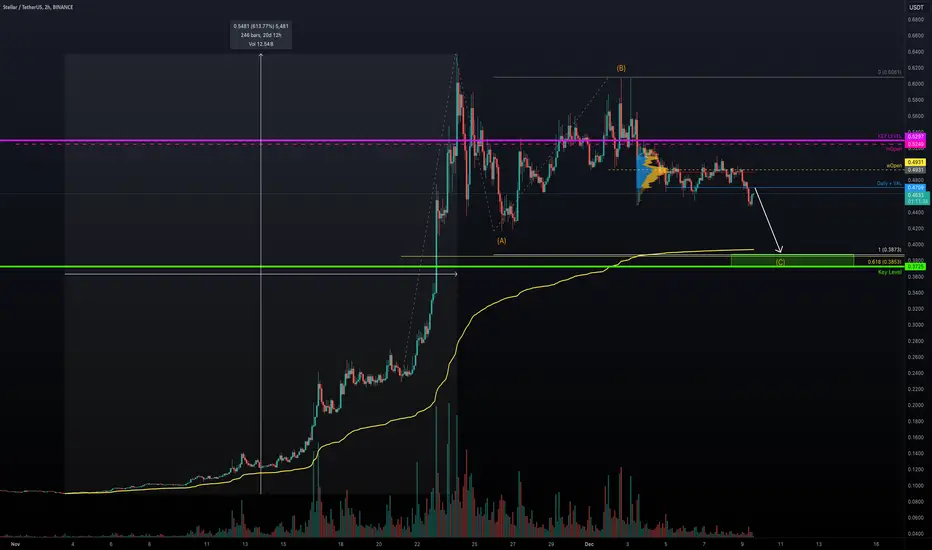
XLM had an increase of over +600% in just 20 days followed by a 15-day consolidation phase suggests an exhaustion of the previous trend. The sideways movement aligns with an ABC correction, where wave C is likely unfolding.
Key Levels and Confluence
Trend-Based Fibonacci Extensions:
1:1 Target for Wave C: $0.3873
Key Support Zone:
$0.3725−$0.3873
Market Sentiment
Lack of Volume: Reflects reduced interest from buyers, confirming a bearish bias.
Below Weekly and Monthly Opens: These levels often act as dynamic resistance, showing bears are in control for now.

🏆 Mastering Fibonacci for precision trading
🔹 Sharing high-probability trade setups
⚡ Unlock the power of technical analysis!
🔹 Sharing high-probability trade setups
⚡ Unlock the power of technical analysis!
คำจำกัดสิทธิ์ความรับผิดชอบ
ข้อมูลและบทความไม่ได้มีวัตถุประสงค์เพื่อก่อให้เกิดกิจกรรมทางการเงิน, การลงทุน, การซื้อขาย, ข้อเสนอแนะ หรือคำแนะนำประเภทอื่น ๆ ที่ให้หรือรับรองโดย TradingView อ่านเพิ่มเติมใน ข้อกำหนดการใช้งาน