
🔥 XNG/USD (NATURAL GAS) - BULLISH TRADE OPPORTUNITY 🔥
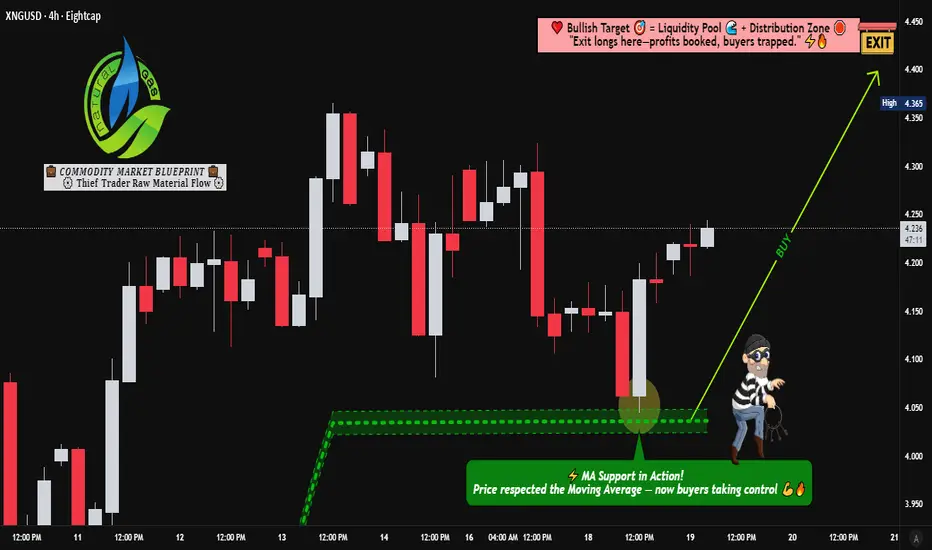
Natural Gas is showing strength with a confirmed bullish structure! This idea outlines a potential day trade as price retests a key moving average support level.
📈 Trade Plan: Bullish
Idea: Long on any retest/dip, targeting a move towards the next significant resistance.
Rationale: Price action confirms a bullish bias, with the Moving Average acting as dynamic support.
🎯 Key Levels & Execution
✅ Entry Zone: Any price level is considered, but a retest of the MA support offers a favorable risk-reward. Be patient for your setup!
🛑 Stop Loss (Risk Management):
My Personal SL: 4.000
⚠️ IMPORTANT NOTE: This is MY stop loss based on MY risk tolerance and strategy. YOU MUST adjust your SL according to your own capital management rules. Trade at your own risk!
🎯 Take Profit Target: 4.400
This level aligns with a strong resistance zone, overbought signals, and a potential correction area. Secure your profits accordingly!
🔍 Related Pairs & Market Correlations
To get a fuller picture of the Energies market, keep an eye on these key assets:
 USOIL / WTI (Crude Oil): 💡 The "big brother" of energy. Often, strength in Crude can pull Natural Gas higher, though the correlation isn't always perfect.
XBRUSD (Brent Oil): 🌍 The international energy benchmark. Similar to WTI, its trends can influence sentiment across the entire energy complex.
 DXY (U.S. Dollar Index): 💵 KEY CORRELATION! Since XNG is quoted against the USD (XNG/USD), a weaker Dollar typically bullish for Natural Gas. A stronger Dollar can act as a headwind. Watch the DXY closely!
 UNG (United States Natural Gas Fund ETF): 📊 A popular ETF that tracks Natural Gas prices. Good for confirming momentum and retail sentiment.
✅ Key Takeaway: A weakeningDXY and strength in USOIL could provide the perfect tailwinds for this XNG/USD bullish move!
👍 Found this helpful? Give it a LIKE & FOLLOW for more daily trade ideas and insights! 🚀
💬 Comment below with your take on Natural Gas! Let's discuss the setup.
Natural Gas is showing strength with a confirmed bullish structure! This idea outlines a potential day trade as price retests a key moving average support level.
📈 Trade Plan: Bullish
Idea: Long on any retest/dip, targeting a move towards the next significant resistance.
Rationale: Price action confirms a bullish bias, with the Moving Average acting as dynamic support.
🎯 Key Levels & Execution
✅ Entry Zone: Any price level is considered, but a retest of the MA support offers a favorable risk-reward. Be patient for your setup!
🛑 Stop Loss (Risk Management):
My Personal SL: 4.000
⚠️ IMPORTANT NOTE: This is MY stop loss based on MY risk tolerance and strategy. YOU MUST adjust your SL according to your own capital management rules. Trade at your own risk!
🎯 Take Profit Target: 4.400
This level aligns with a strong resistance zone, overbought signals, and a potential correction area. Secure your profits accordingly!
🔍 Related Pairs & Market Correlations
To get a fuller picture of the Energies market, keep an eye on these key assets:
USOIL / WTI (Crude Oil): 💡 The "big brother" of energy. Often, strength in Crude can pull Natural Gas higher, though the correlation isn't always perfect.XBRUSD (Brent Oil): 🌍 The international energy benchmark. Similar to WTI, its trends can influence sentiment across the entire energy complex.DXY (U.S. Dollar Index): 💵 KEY CORRELATION! Since XNG is quoted against the USD (XNG/USD), a weaker Dollar typically bullish for Natural Gas. A stronger Dollar can act as a headwind. Watch the DXY closely!UNG (United States Natural Gas Fund ETF): 📊 A popular ETF that tracks Natural Gas prices. Good for confirming momentum and retail sentiment.✅ Key Takeaway: A weakening
DXY and strength in USOIL could provide the perfect tailwinds for this XNG/USD bullish move!👍 Found this helpful? Give it a LIKE & FOLLOW for more daily trade ideas and insights! 🚀
💬 Comment below with your take on Natural Gas! Let's discuss the setup.
การซื้อขายยังคงดำเนินอยู่
ปิดการเทรด: ถึงเป้าหมายการทำกำไร

การนำเสนอที่เกี่ยวข้อง
คำจำกัดสิทธิ์ความรับผิดชอบ
ข้อมูลและบทความไม่ได้มีวัตถุประสงค์เพื่อก่อให้เกิดกิจกรรมทางการเงิน, การลงทุน, การซื้อขาย, ข้อเสนอแนะ หรือคำแนะนำประเภทอื่น ๆ ที่ให้หรือรับรองโดย TradingView อ่านเพิ่มเติมใน ข้อกำหนดการใช้งาน
การนำเสนอที่เกี่ยวข้อง
คำจำกัดสิทธิ์ความรับผิดชอบ
ข้อมูลและบทความไม่ได้มีวัตถุประสงค์เพื่อก่อให้เกิดกิจกรรมทางการเงิน, การลงทุน, การซื้อขาย, ข้อเสนอแนะ หรือคำแนะนำประเภทอื่น ๆ ที่ให้หรือรับรองโดย TradingView อ่านเพิ่มเติมใน ข้อกำหนดการใช้งาน