
Market Overview
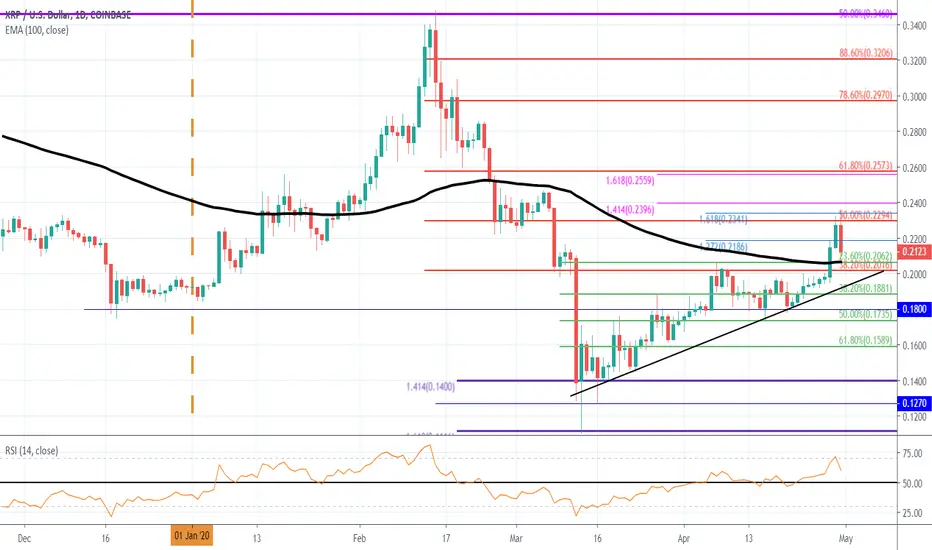
XRP managed to increase by 15% this week as the cryptocurrency finally broke above the $0.20 level. The cryptocurrency had been struggling to break above $0.20 since the March market collapse but managed to penetrate above here on Tuesday when it surged past the 100-days EMA at $0.206 and closed at $0.218 (1.272 Fib Extension).
Yesterday, XRP continued higher into the bearish .5 Fib Retracement level at $0.23. In today’s trading session, XRP has dropped lower as it trades at $0.218.
Short term prediction: BULLISH
The break above $0.20 has now turned XRP bullish and it would need to drop beneath $0.20 to turn neutral again. If it was to drop beneath $0.18, the market would be considered as bearish.
If the buyers manage to rebound from $0.218 and push higher, the first level of strong resistance lies at $0.229 (bearish .5 Fib Retracement). Above this, resistance is located at $0.234, $0.24 (1.414 Fib Extension), and $0.257 (bearish .618 Fib Retracement).
Toward the downside, support lies at $0.21, $0.206 (100-days EMA & .236 Fib Retracement), $0.20, and $0.1881 (.382 Fib Retracement). Following this, added support lies at $0.18.
The RSI has dropped from overbought conditions as the bullish momentum is starting to show some signs of weakness.
XRP managed to increase by 15% this week as the cryptocurrency finally broke above the $0.20 level. The cryptocurrency had been struggling to break above $0.20 since the March market collapse but managed to penetrate above here on Tuesday when it surged past the 100-days EMA at $0.206 and closed at $0.218 (1.272 Fib Extension).
Yesterday, XRP continued higher into the bearish .5 Fib Retracement level at $0.23. In today’s trading session, XRP has dropped lower as it trades at $0.218.
Short term prediction: BULLISH
The break above $0.20 has now turned XRP bullish and it would need to drop beneath $0.20 to turn neutral again. If it was to drop beneath $0.18, the market would be considered as bearish.
If the buyers manage to rebound from $0.218 and push higher, the first level of strong resistance lies at $0.229 (bearish .5 Fib Retracement). Above this, resistance is located at $0.234, $0.24 (1.414 Fib Extension), and $0.257 (bearish .618 Fib Retracement).
Toward the downside, support lies at $0.21, $0.206 (100-days EMA & .236 Fib Retracement), $0.20, and $0.1881 (.382 Fib Retracement). Following this, added support lies at $0.18.
The RSI has dropped from overbought conditions as the bullish momentum is starting to show some signs of weakness.

คำจำกัดสิทธิ์ความรับผิดชอบ
ข้อมูลและบทความไม่ได้มีวัตถุประสงค์เพื่อก่อให้เกิดกิจกรรมทางการเงิน, การลงทุน, การซื้อขาย, ข้อเสนอแนะ หรือคำแนะนำประเภทอื่น ๆ ที่ให้หรือรับรองโดย TradingView อ่านเพิ่มเติมใน ข้อกำหนดการใช้งาน
คำจำกัดสิทธิ์ความรับผิดชอบ
ข้อมูลและบทความไม่ได้มีวัตถุประสงค์เพื่อก่อให้เกิดกิจกรรมทางการเงิน, การลงทุน, การซื้อขาย, ข้อเสนอแนะ หรือคำแนะนำประเภทอื่น ๆ ที่ให้หรือรับรองโดย TradingView อ่านเพิ่มเติมใน ข้อกำหนดการใช้งาน