Long
$XVG #XVG #altseason fractal confluences compared
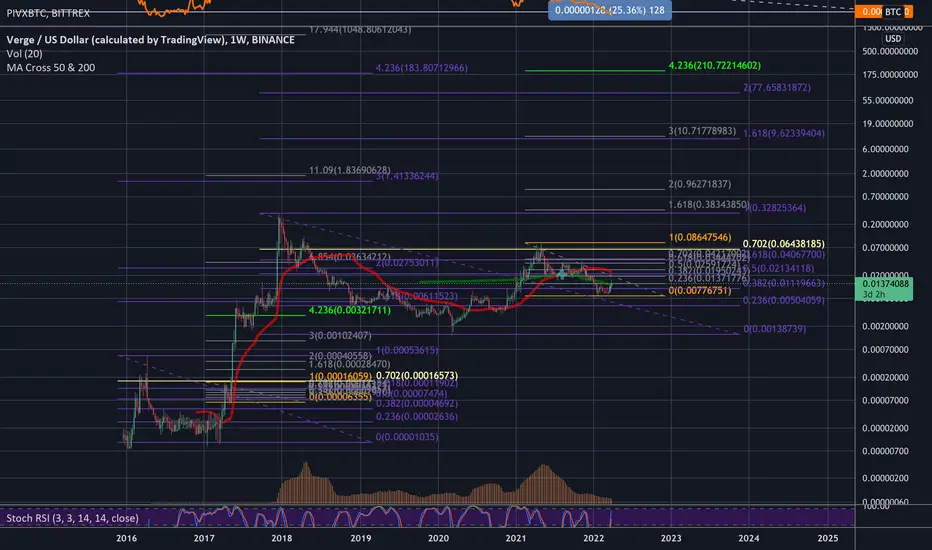
Please note the following:
Questions to ponder:
Looking forward to your comments.
- two fractals shown between ORANGE lines - one in 2017/18 cycle and one now
- two macro fib retracements for each of these same two cycles with the .702 fib level in YELLOW
- "fib levels based on log scale" is turned on for each
Questions to ponder:
- Are these ORANGE fractals comparable to one another? Are they valid with respect to the relationship each has with their corresponding cycles?
- Very interesting to see the each of the ORANGE fractals starting at the .702!
- Does this mean the current fractal has potential to hit the 4.236 ($210 seems crazy) or beyond?
Looking forward to your comments.

การนำเสนอที่เกี่ยวข้อง
คำจำกัดสิทธิ์ความรับผิดชอบ
ข้อมูลและบทความไม่ได้มีวัตถุประสงค์เพื่อก่อให้เกิดกิจกรรมทางการเงิน, การลงทุน, การซื้อขาย, ข้อเสนอแนะ หรือคำแนะนำประเภทอื่น ๆ ที่ให้หรือรับรองโดย TradingView อ่านเพิ่มเติมใน ข้อกำหนดการใช้งาน
การนำเสนอที่เกี่ยวข้อง
คำจำกัดสิทธิ์ความรับผิดชอบ
ข้อมูลและบทความไม่ได้มีวัตถุประสงค์เพื่อก่อให้เกิดกิจกรรมทางการเงิน, การลงทุน, การซื้อขาย, ข้อเสนอแนะ หรือคำแนะนำประเภทอื่น ๆ ที่ให้หรือรับรองโดย TradingView อ่านเพิ่มเติมใน ข้อกำหนดการใช้งาน