ที่อัปเดต:
ZClassic
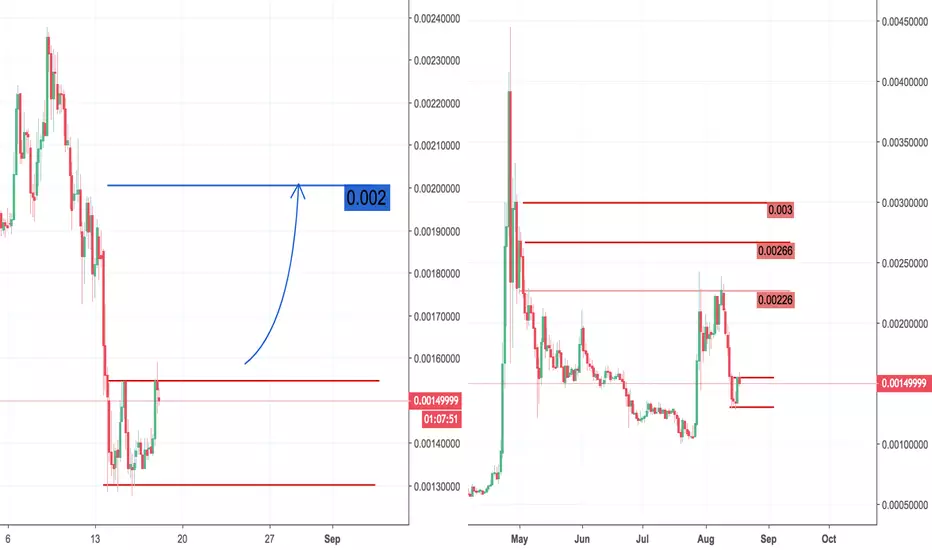
The left chart shows the trading range we are currently in. A break up would result in testing the 0.002 as a short term projection.
The right chart indicates more a long term projection. The resistance lines are shown.
Big news will follow up, until the fork happening on 10th of September.
The ANON Team will be announcing exchange markets , and some new surprises, which in my opinion will lead to the highs. Let's see :)
The right chart indicates more a long term projection. The resistance lines are shown.
Big news will follow up, until the fork happening on 10th of September.
The ANON Team will be announcing exchange markets , and some new surprises, which in my opinion will lead to the highs. Let's see :)
บันทึก

คำจำกัดสิทธิ์ความรับผิดชอบ
ข้อมูลและบทความไม่ได้มีวัตถุประสงค์เพื่อก่อให้เกิดกิจกรรมทางการเงิน, การลงทุน, การซื้อขาย, ข้อเสนอแนะ หรือคำแนะนำประเภทอื่น ๆ ที่ให้หรือรับรองโดย TradingView อ่านเพิ่มเติมใน ข้อกำหนดการใช้งาน
คำจำกัดสิทธิ์ความรับผิดชอบ
ข้อมูลและบทความไม่ได้มีวัตถุประสงค์เพื่อก่อให้เกิดกิจกรรมทางการเงิน, การลงทุน, การซื้อขาย, ข้อเสนอแนะ หรือคำแนะนำประเภทอื่น ๆ ที่ให้หรือรับรองโดย TradingView อ่านเพิ่มเติมใน ข้อกำหนดการใช้งาน