
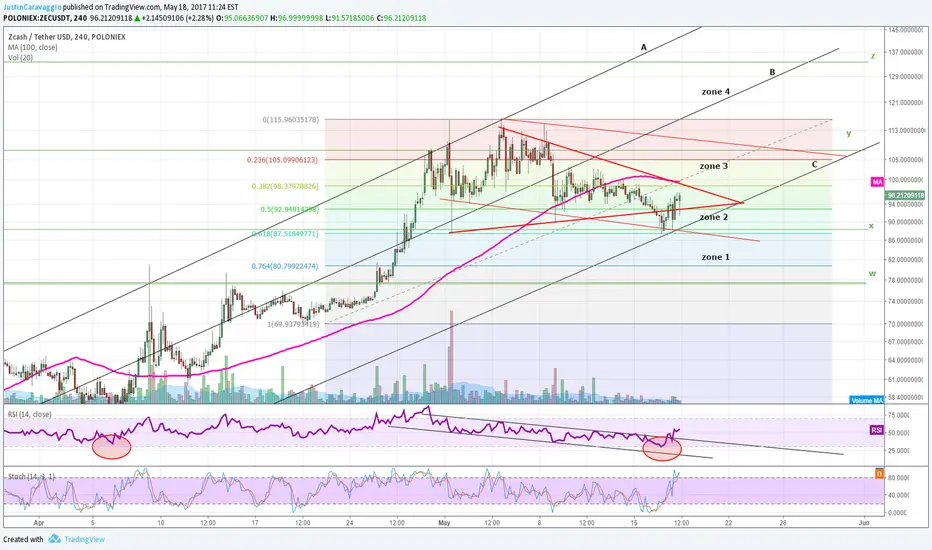
Zcash is forming a red triangle while bouncing off of the bottom of zone 3 (lower part of diagonal channel)
If we can see enough strength to pass through the 38% fib retracement, the 100 day moving average (pink line) and the red triangle we could see a move to to roughly 110 USD ( line y, 23% ret and upper red trend line resistance).
Watch for RSI to approach 70. If we breach 70 its possible we could see a move to the upper end of zone 3, finding resistance at the bottom of zone 4.
Watch for stochastics to embed about 80
Falling out of the triangle to the downside could result in a drop to zone 1, with line w and the 76% retracement as support.
If we can see enough strength to pass through the 38% fib retracement, the 100 day moving average (pink line) and the red triangle we could see a move to to roughly 110 USD ( line y, 23% ret and upper red trend line resistance).
Watch for RSI to approach 70. If we breach 70 its possible we could see a move to the upper end of zone 3, finding resistance at the bottom of zone 4.
Watch for stochastics to embed about 80
Falling out of the triangle to the downside could result in a drop to zone 1, with line w and the 76% retracement as support.

คำจำกัดสิทธิ์ความรับผิดชอบ
ข้อมูลและบทความไม่ได้มีวัตถุประสงค์เพื่อก่อให้เกิดกิจกรรมทางการเงิน, การลงทุน, การซื้อขาย, ข้อเสนอแนะ หรือคำแนะนำประเภทอื่น ๆ ที่ให้หรือรับรองโดย TradingView อ่านเพิ่มเติมใน ข้อกำหนดการใช้งาน
คำจำกัดสิทธิ์ความรับผิดชอบ
ข้อมูลและบทความไม่ได้มีวัตถุประสงค์เพื่อก่อให้เกิดกิจกรรมทางการเงิน, การลงทุน, การซื้อขาย, ข้อเสนอแนะ หรือคำแนะนำประเภทอื่น ๆ ที่ให้หรือรับรองโดย TradingView อ่านเพิ่มเติมใน ข้อกำหนดการใช้งาน