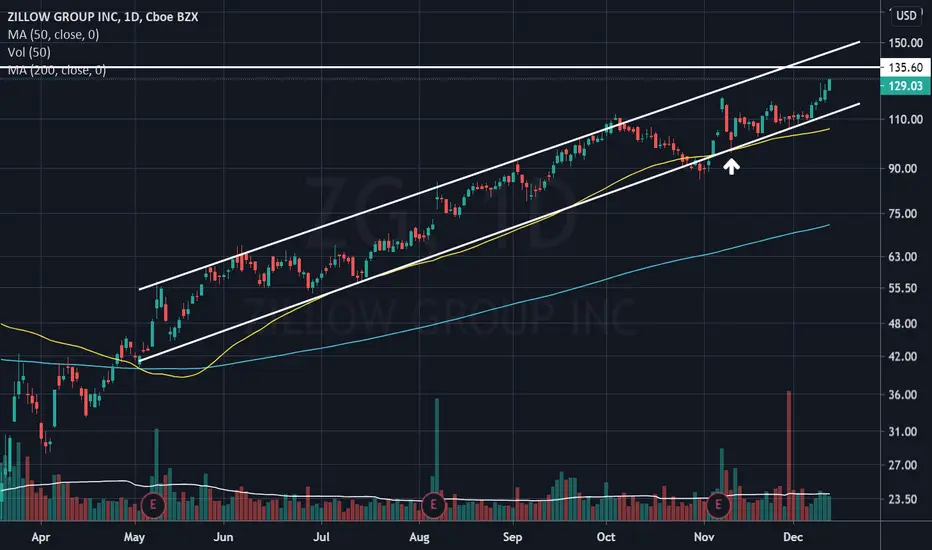
 ZG exhibited a well respected trend channel since April 2020, a significant 8 months duration. It underwent a technical sell off of -15.76%, on 9th November 2020, with price action being resisted at its upper trendline.
The exhaustion of the selling was witnessed during the afternoon session of 10th November 2020, with
ZG closing the day with a Bullish Reversal Hammer Candlestick Pattern (highlighted), coinciding with the lower band support of the trend channel.The continuation of this all time high breakout rally is likely to see
ZG test its upper trendline resistance at $135.00 in the upcoming week.
คำจำกัดสิทธิ์ความรับผิดชอบ
ข้อมูลและบทความไม่ได้มีวัตถุประสงค์เพื่อก่อให้เกิดกิจกรรมทางการเงิน, การลงทุน, การซื้อขาย, ข้อเสนอแนะ หรือคำแนะนำประเภทอื่น ๆ ที่ให้หรือรับรองโดย TradingView อ่านเพิ่มเติมใน ข้อกำหนดการใช้งาน
คำจำกัดสิทธิ์ความรับผิดชอบ
ข้อมูลและบทความไม่ได้มีวัตถุประสงค์เพื่อก่อให้เกิดกิจกรรมทางการเงิน, การลงทุน, การซื้อขาย, ข้อเสนอแนะ หรือคำแนะนำประเภทอื่น ๆ ที่ให้หรือรับรองโดย TradingView อ่านเพิ่มเติมใน ข้อกำหนดการใช้งาน