
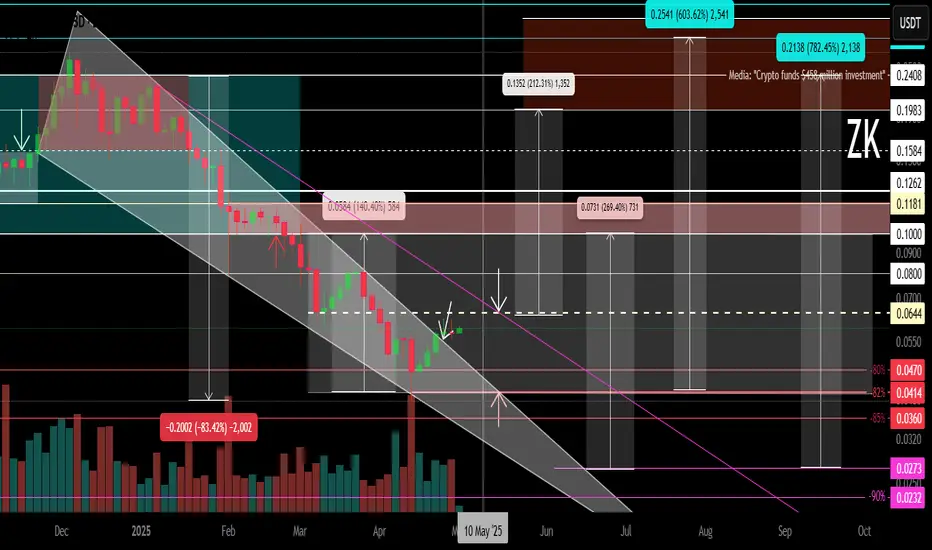
Logarithm. Time frame 3 days. Decrease from listing about -82%. For cryptocurrencies of such liquidity and capitalization, this is not the maximum decrease (-90-96%). But sometimes from such values as now (-82-85%), taking into account the news hype during the listing "whales $ 458 million", a reversal and strong pumping can occur under the market as a whole. For example, like another hype project of "hanging noodles" - Flare (distributed to XRP holders). Decrease by -82% and then pumping slightly above the listing price under the next alt season of the cycle + 560%.

This does not necessarily mean that this will happen, this is an example of what happens from such values of decline with such liquidity and hype. In some ways, not only in the structure of the TA formation, but in the hype and disappointment of "investors", the projects are identical.
Main trend, and the previously shown zone, in which the price is now.
ZkSync Main trend. L2 for ETH. $458 million funds 21 02 2025
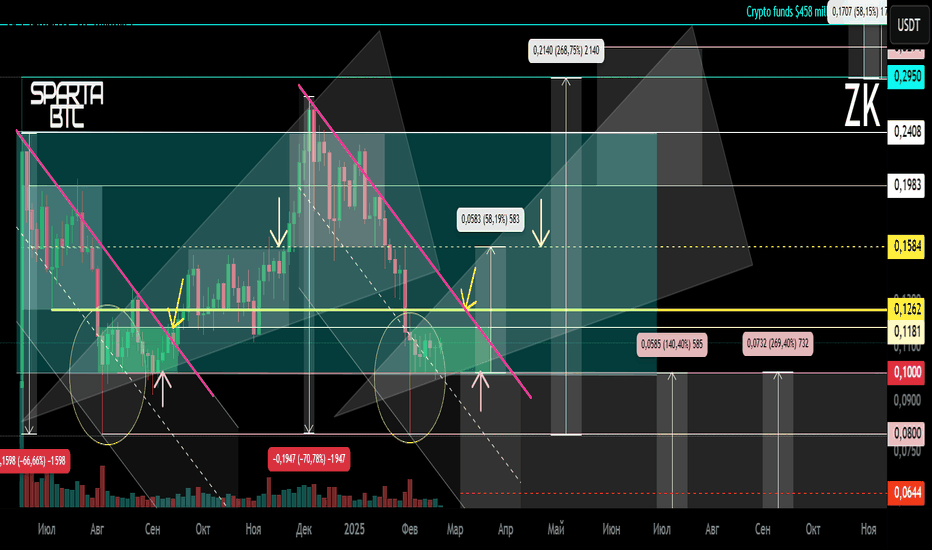
Main trend now in the moment (full trading history).

There is no need to guess the minimums and maximums. It is important to know these zones and have an acceptable average price, from the position of the trend and its potential. It is regulated by the distributed entry volume (in advance) at potential reversal zones.
This does not necessarily mean that this will happen, this is an example of what happens from such values of decline with such liquidity and hype. In some ways, not only in the structure of the TA formation, but in the hype and disappointment of "investors", the projects are identical.
Main trend, and the previously shown zone, in which the price is now.
ZkSync Main trend. L2 for ETH. $458 million funds 21 02 2025
Main trend now in the moment (full trading history).
There is no need to guess the minimums and maximums. It is important to know these zones and have an acceptable average price, from the position of the trend and its potential. It is regulated by the distributed entry volume (in advance) at potential reversal zones.
การซื้อขายยังคงดำเนินอยู่
12 09 2025 Note, ladies and gentlemen, but not ... this range (where the price has never been), were shown extremely accurately, + the zone of removing long stops, back in February, that is, 9 months ago, during the listing, that is, on the hype "funds bought for 0.5 billion dollars", soon, a rocket.
Now (in any zone of the sideways movement), buyers on the listing (hype, direction of thinking), have the fortitude to average their specifically unprofitable media position -84%, with a large volume, in order to somehow bring the exit on the money spent (without loss), or to a minimum profit. Or similar, money management implies only buying for the "cutlet", on the instructions of "someone there" on the hype of media injections of "correct information"?
บันทึก
02 November 2025 All these percentages, and the logic behind the reversal zones, were previously outlined when the trading idea was published five months ago, that is, before the formation of a six-month-long channel, its range, and the accumulation of liquidity beneath it. Are you still wondering? Are you interested in news for speculative fools? Maybe there's a better way? That is, in what I've probably talked about a thousand times already, namely:
1) Your trading tactics (how you plan to make money in the market).
2) Risk management (how sane you are and how sound your logic is).
3) A familiarity with charts—accumulated visual and other experience—helps you understand and create quality decisions (hundreds of identical trading situations, the logic of outcomes, what you've previously seen, observed, and participated in—that is, your experience and intelligence). Those who are stupid and rotten will never understand how they choose a different path—that is, guessing and hitting the jackpot, instead of understanding and working.
On such altcoins, price charts are identical. This will essentially happen everywhere over time, after such long runs, sometimes more, sometimes less, depending on the instrument's #liquidity and the crowd's involvement, i.e., #hype.
บันทึก
November 6, 2025 บันทึก
Logarithm. 3-day timeframe.Main trend for clarity (lower zone of the descending channel).
Declines from the high ("funds are buying 458 million worth of nothing") - 90%.
The long squeeze, due to the extremely low liquidity of the former hyped "saving the world" instrument, was carried out by a phenomenal -93% on a half-empty order book.
Secondary and local trends.
The key is a breakout of the descending wedge and local resistance zone.
Reversal zones and % of key support/resistance levels for building a trading plan and risk management.
Most market participants find it very unpleasant and difficult (they can't bring themselves to) to buy low (fear) and sell high (greed). For them, it's the other way around.
Manage your risks and stick to your trading plan. Don't get caught up in market and news noise, which shapes the opinions and illogical actions of the majority, who are doomed to lose in the future.

✅ Telegram. Finance + Trading: t.me/+ajtMAB9qbF82ZmJi
✅ Telegram. Сrypto trading only: t.me/+4Bux2Gd8Bo9hNTRi
✅ Instagram: instagram.com/spartabtc_1318
✅ YouTube (Rus): goo.su/vpRzRa2
✅ Telegram. Сrypto trading only: t.me/+4Bux2Gd8Bo9hNTRi
✅ Instagram: instagram.com/spartabtc_1318
✅ YouTube (Rus): goo.su/vpRzRa2
การนำเสนอที่เกี่ยวข้อง
คำจำกัดสิทธิ์ความรับผิดชอบ
ข้อมูลและบทความไม่ได้มีวัตถุประสงค์เพื่อก่อให้เกิดกิจกรรมทางการเงิน, การลงทุน, การซื้อขาย, ข้อเสนอแนะ หรือคำแนะนำประเภทอื่น ๆ ที่ให้หรือรับรองโดย TradingView อ่านเพิ่มเติมใน ข้อกำหนดการใช้งาน
✅ Telegram. Finance + Trading: t.me/+ajtMAB9qbF82ZmJi
✅ Telegram. Сrypto trading only: t.me/+4Bux2Gd8Bo9hNTRi
✅ Instagram: instagram.com/spartabtc_1318
✅ YouTube (Rus): goo.su/vpRzRa2
✅ Telegram. Сrypto trading only: t.me/+4Bux2Gd8Bo9hNTRi
✅ Instagram: instagram.com/spartabtc_1318
✅ YouTube (Rus): goo.su/vpRzRa2
การนำเสนอที่เกี่ยวข้อง
คำจำกัดสิทธิ์ความรับผิดชอบ
ข้อมูลและบทความไม่ได้มีวัตถุประสงค์เพื่อก่อให้เกิดกิจกรรมทางการเงิน, การลงทุน, การซื้อขาย, ข้อเสนอแนะ หรือคำแนะนำประเภทอื่น ๆ ที่ให้หรือรับรองโดย TradingView อ่านเพิ่มเติมใน ข้อกำหนดการใช้งาน