Long trade
📊 TRADINGVIEW IDEA PANEL — XAUUSD BUYSIDE SETUP
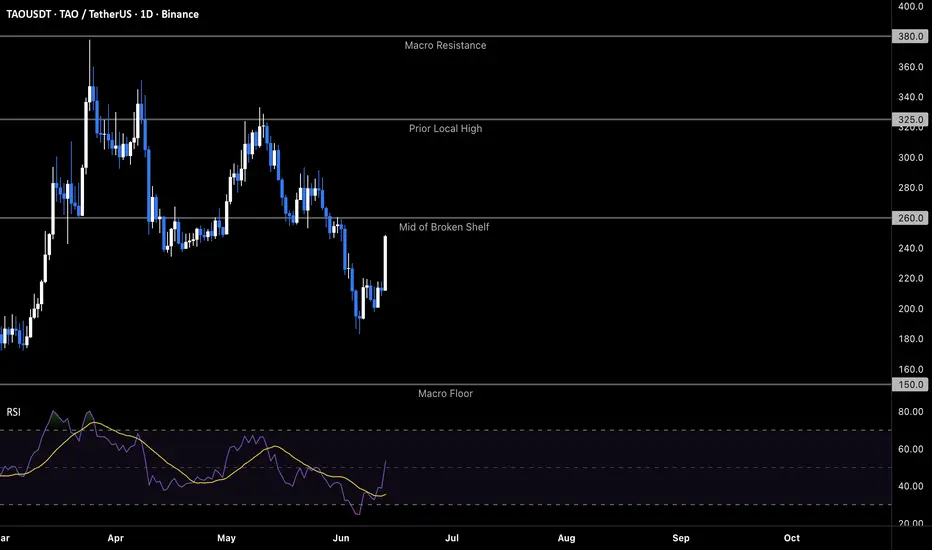
PAIR:
XAUUSD
DIRECTION:
🟢 Buyside trade idea
DATE:
Mon 15th June 2026
SESSION:
LND Session AM
ENTRY TIME:
5:20 am
ENTRY:
4341.45
STOP:
4328.96
TARGET:
4405.22
RR:
5.1
TIMEFRAME:
5-minute execution / 15-minute context
HTF BIAS:
🟢 Bullish recovery after strong sellside delivery into discount. Price formed a base at the lower range, reclaimed structure, and began building higher lows back through the TR Main Indicator recovery zone.
LIQUIDITY DRAW:
Buyside liquidity above price, targeting the upper range/premium objective around 4405.22.
SNAP MAP:
Markdown → discount accumulation → fair-value reclaim → buyside recovery expansion.
Price delivered aggressively into the discount, found support in the lower-demand area, then shifted structure with a bullish displacement. The recovery leg respected multiple bullish FVGs and continued holding above the TR Main Indicator support structure.
TRIGGER:
Buyside continuation trigger activated after price reclaimed fair value, held the FVG support zone, and continued forming higher lows above the TR Main Indicator cloud.
The 5-minute entry aligned with the 15-minute recovery map, confirming that the earlier sellside move had likely completed and the price was now repricing toward upper liquidity.
INVALIDATION:
4328.96.
Trade is invalid if the price loses the reclaimed FVG support area and falls below the recovery base. Early warning appears if the price breaks below 4334–4330 and fails to reclaim quickly.
CONFLUENCES:
✅ Discount base formed after sellside delivery
✅ Price reclaimed fair value
✅ Bullish FVG ladder supported the move
✅ TR Main Indicator shifted from resistance to support
✅ Higher-low structure confirmed recovery
✅ RSI remained constructive during the pullback
✅ London AM timing supported active expansion
✅ Target aligns with upper liquidity/premium resistance
✅ RR profile remains strong at 5.12
SENTIMENT / NEWS:
Gold remains sensitive to macro risk, dollar strength, yields, and safe-haven flows. The chart currently supports a technical recovery, but the trade should still be managed carefully as the price approaches premium resistance. A stronger dollar or rising yields could cap upside, while risk-off flows or renewed gold demand would support continuation.
FINAL SNAP READ:
XAUUSD reclaimed from discount, respected the TR Main Indicator recovery structure, and is targeting upper liquidity at 4405.37. The buyside idea remains valid while 4328.96 holds.  Long
Long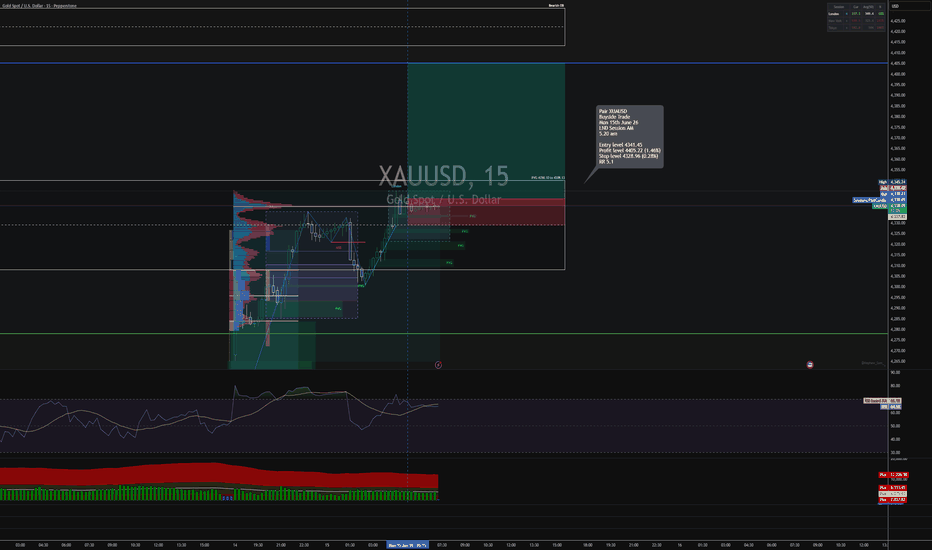
Long trade
📊 TRADINGVIEW IDEA PANEL — SUIUSDT BUYSIDE SETUP
PAIR:
SUIUSDT
DIRECTION:
🟢 Buyside trade idea
DATE:
Sun 14th June 2026
SESSION:
Tokyo Session PM
ENTRY TIME:
5:45 pm
ENTRY:
0.7778
STOP:
0.7750
TARGET:
0.8322
RR:
19.43
TIMEFRAME:
15-minute execution / higher-timeframe recovery context
HTF BIAS:
🟢 Bullish recovery after prior sellside delivery and extended basing. Price moved from a markdown environment into a broad accumulation range, then broke higher through the range ceiling with bullish displacement.
LIQUIDITY DRAW:
Buyside liquidity above price, targeting the premium objective at 0.8322. The target aligns with the upper projected range and prior imbalance/liquidity zone above the breakout.
SNAP MAP:
Markdown → accumulation range → fair-value reclaim → buyside displacement → continuation.
Price spent time building inside the lower-to-mid range, showing compression and balance after the prior selloff. The breakout above the range created a clear shift in delivery. Price then held above the breakout base and began forming a bullish continuation structure.
TRIGGER:
Buyside trigger activated after price broke above the accumulation range, reclaimed fair value, and held the breakout zone as support.
The entry at 0.7778 came after the price expanded away from the range and began respecting the new bullish structure. The stop at 0.7750 sits tightly below the breakout support / immediate invalidation zone, giving the trade a strong RR profile.
INVALIDATION:
0.7750.
Trade invalid if the price loses the breakout support and reverts to the prior range. A clean break back below 0.7750 would suggest the breakout failed, and price may rotate back into the old accumulation area.
CONFLUENCES:
✅ Prior markdown created discount conditions
✅ Broad accumulation range formed before expansion
✅ Range high was reclaimed
✅ Price shifted from balance into bullish displacement
✅ FVG structure supported continuation
✅ Entry aligned with breakout acceptance
✅ Stop placed below immediate invalidation
✅ Target aimed at upper liquidity/premium objective
✅ Strong RR profile at 19.43
SENTIMENT / NEWS:
SUI is behaving like a high-beta crypto recovery play. The technical chart shows strong recovery behaviour, but continuation still depends on broader crypto risk appetite and Bitcoin stability. If BTC remains supported and the crypto basket stays bid, SUI can continue attracting momentum flows toward the 0.8322 target. If broader crypto weakens, the tight invalidation below 0.7750 becomes important.
FINAL SNAP READ:
SUIUSDT broke out of accumulation, reclaimed fair value, and shifted into buyside delivery. The trade remains valid while 0.7750 holds, with 0.8322 acting as the primary buyside liquidity target.  Long
Long
 Long
Long
Long 
Short 
 Long
Long
 Short
Short
 Long
Long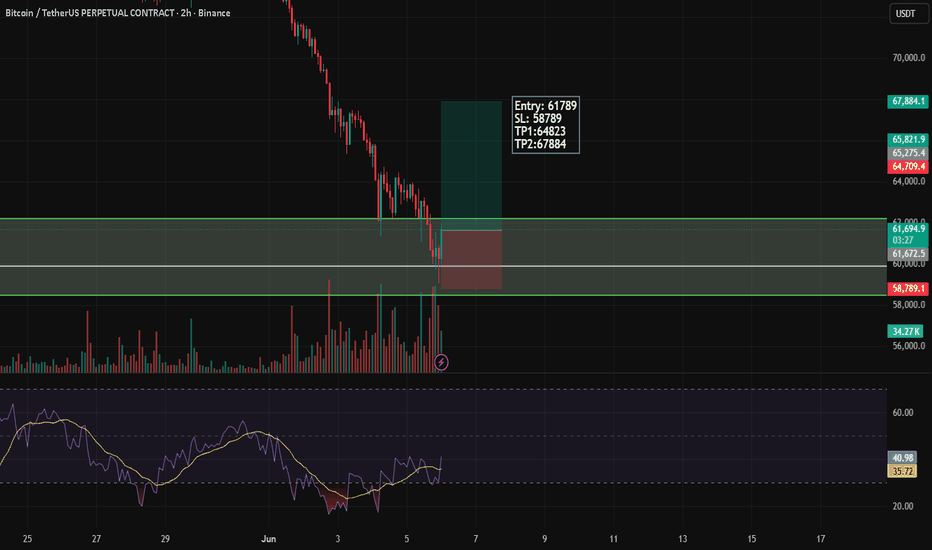
BTCUSDT post-sweep reclaim: targeting $68,000The Macro Picture 🗺️
The bearish continuation thesis from June 9 has shifted into structural suspension — the $59,000 sweep low held, price reclaimed the $60,000 macro floor without breaking it twice, and a bullish RSI divergence has now printed against the capitulation low. What looked like a textbook breakdown into open air is showing the structural signature of a sweep-and-reclaim instead, where the deepest reading since February's flush marked exhaustion rather than continuation. The recovery leg now faces its first real test at the $66,000–$68,000 supply zone — the broken range floor that desperately needs to be reclaimed before any structural reset narrative can take hold.
The Setup ⚙️
The Reclaim: The $60,000 macro floor was lost on June 6 but reclaimed within three sessions, neutralizing the breakdown signal — clean structural sweeps usually print one violation, not multiple, and the lack of follow-through below the floor reads as over-leveraged shorts getting trapped above the line.
The Divergence: RSI printed its lowest reading since the February capitulation while bouncing off the $59,000 wick — the classic bullish divergence signature that historically marks structural exhaustion at macro floors rather than continuation triggers.
The Decision Pocket: The $66,000–$68,000 supply zone is now the binary trigger on the chart. A clean reclaim flips the broken range floor back into support and reopens the structural path higher; a clean rejection sends price back toward the swept low and re-activates the June 9 thesis.
The Roadmap: Primary target sits at $68,000 — the broken range floor where prior demand from April's higher-low sequence now sits stacked as overhead supply, and the level that bears must defend to keep the larger downtrend intact. Invalidation: a sustained 1D close back below $59,000 would invalidate this bullish reclaim thesis and re-open the path toward $55,000 from the prior bearish read. Short 
NVDAUSDT: local squeeze with $225 destinationThe Macro Picture 🗺️
NVDAUSDT carved its structural peak at $241 in mid-May and has spent the weeks since in a controlled descent of lower highs — $241, then $225, then $215. But the pullback has refused to break: the $202 prior break level, the floor that launched May's rally, has now been defended twice on the retest. The result is a Local Squeeze high in the macro range, where a descending lid of supply compresses against a firm horizontal floor — a structure that resolves with force once one side gives.
The Setup ⚙️
The Floor: The $200–$202 prior break level has held two distinct tests this month, each bounce confirming that buyers are defending the level that launched the macro uptrend. This is the line that separates a healthy pullback from a structural breakdown, and so far the bulls are holding it.
The Lid: The descending sequence of lower highs has parked immediate supply at $215, with the $225 local high stacked above it. Each rejection has come on fading momentum rather than impulsive selling — the signature of a market coiling rather than trending, exactly what keeps RSI pinned flat at its mid-line.
The Trigger: A reclaim of $215 on a 1D close is the confirmation the squeeze resolves upward, clearing the descending lid and exposing the buy stops layered above the $225 local high.
The Roadmap: Primary target sits at $225 — the local high and upper edge of the squeeze, a high-confluence zone where the next leg of the macro trend either confirms or stalls. Invalidation: a sustained 1D close below $202 would invalidate this bullish thesis, flip the prior break level back to resistance, and reopen the path toward the $164 macro floor. INJ post-sweep reclaim: targeting $6.00 retestThe Macro Picture 🗺️
The post-parabolic unwind has reached the same $5.00 critical floor that launched the entire May rally — and bulls have defended it with the kind of structural conviction that frequently marks local bottoms. The wick to $4.80 on June 10–11 swept liquidity below the round-number floor and trapped late shorts who positioned for the $4.50 magnet, but the daily close reclaimed $5.00 cleanly, and price has held inside the $5.00–$5.50 compression zone ever since. RSI has stabilized near 45 after rolling out of the bearish acceleration regime, neither confirming a full reversal nor extending the downside impulse. This is the structural pivot the post-parabolic correction needs — a defended floor, an absorbed liquidity sweep, and the energy to attempt a reclaim of the broken supply shelf above.
The Setup ⚙️
The Sweep: The $4.80 wick on June 10–11 cleared out over-leveraged shorts parked beneath the $5.00 psychological floor, completing the liquidity hunt that the parabolic unwind required and resetting the funding profile in the bulls' favor.
The Floor Defense: The $5.00 round number, the May rally launchpad, and the post-breakout structural origin all stack at the same level — bulls have now defended this high-confluence pocket on consecutive daily closes, signaling that buyers desperately want to hold this band.
The Trigger: A sustained daily close above $5.50 would confirm the post-sweep reclaim and reactivate the path of least resistance toward $6.00, where the broken macro flip now sits as the first major overhead supply test.
The Roadmap: Primary target sits at $6.00 — once $5.50 gives way to the upside, the white projection points through the dead-air pocket toward the prior macro flip zone where structural sellers will reload. Invalidation: a clean daily close below $4.80 would invalidate this bullish reclaim and re-activate the path toward the $4.50 liquidity magnet. JUPUSDT at macro floor: bullish reversal toward $0.200The Macro Picture 🗺️
The June 3 continuation thesis broke down through every structural level it relied on — $0.200 lost, $0.165 lost, and price kept selling until it wicked into the $0.140 macro floor on the June 10–11 flush. That sweep is the third test of the floor since January and the second clean defense, with a wide-range wick rejection launching the current reversal off ~$0.144. The character has shifted entirely: this is no longer a continuation read, it is a structural reversal off the same macro floor that has anchored the entire 2026 base.
The Setup ⚙️
The Sweep: Price punctured $0.140 by a hair before snapping back inside the prior range, clearing out the over-leveraged shorts that piled in on the break of the $0.165 floor. The sweep candle is wide-range and decisive — the kind of print that tends to mark structural lows rather than continuation pauses.
The Reaction: RSI lifted from the mid-30s without printing oversold capitulation, and has begun curling back toward the 50 midline. Momentum reset is in progress, but it is slow and accumulative — not the spike-and-fade pattern that signals a one-and-done relief bounce.
The Reclaim Path: The overhead structure is stacked. Trapped longs from the May rally sit between $0.180 and $0.200, with the lost pivot at $0.200 marking the first level that needs to be reclaimed before the bearish character can fully invert.
The Roadmap: Primary target sits at $0.200 — the broken pivot from the June 3 thesis, now the natural magnet on the reclaim path. Invalidation: a sustained 1D close below $0.140 would invalidate this reversal thesis, signal that the macro floor has finally given way, and open the path toward unmapped territory. How to Trade Liquidity Grab, Order Block and Imbalance (SMC)
I will teach you how to trade liquidity grab, a trap, inducement, order block and imbalance.
I will share with you my Smart Money Concept strategy for trading forex gold.
We will study a real SMC trading setup that I took on a live stream with my students.
Trend Analysis With Structure Mapping
The first step in our trading strategy will be the analysis of a market trend on a daily time frame with structure mapping.
Analyzing GBPNZD on a daily time frame, we can see that the conditions for a bullish trend are met.
The second step will be to find liquidity - supply and demand zones on a daily time frame.
According to our rules, here are 3 liquidity zones that I spotted on GBPNZD. We see 2 demand zones and 1 supply zone.
The third step will be to wait for a test of a liquidity zone.
And on that step, we should remember an important rule:
we will wait only for a test of a liquidity zone that ALIGN with the market trend.
It means that we will wait for a test of a demand zone in a bullish trend.
We will wait for a test of a supply zone in a bearish trend.
The only demand zones that meets these criteria on GBPNZD is Demand Zone 1.
It aligns with a bullish trend.
We don't consider Demand Zone 2, because a bearish violation of a Demand Zone 1 will be a Change of Character and a violation of a bearish trend.
And here is how a test of a liquidity zone should look like. The price should simply reach that.
After we identify a test of a significant liquidity zone that aligns with a market trend, we will start analyzing lower time frames.
We will look for a liquidity grab, order block and imbalance on 4H and 1H time frames.
Here is a liquidity grab that is confirmed by a bullish imbalance.
We see a false violation of a liquidity zone, followed by a high momentum bullish candle.
It will be our strong bullish signal.
In order to identify the entry point, the next step will be to identify the order block.
According to our rules, here is the order block zone on a 4H time frame.
Our entry level will be the level of the upper boundary of the order block zone.
Here is such a level on GBPNZD.
A buy limit order should be set on that level.
Safe stop loss should be below the lowest low of a bearish movement.
To safely calculate a stop loss in pips for the trade, simply take 0.5 ATR - Average True Range.
For Average True Range indicator, take the default settings - 14 length.
Here is a safe stop loss level on GBPNZD. ATR is 55 pips. Our stop loss for the trade is 28 pips.
Take profit for the trade will be based on the closes 4H liquidity - supply zone.
That is the closest supply zone that I spotted on GBPNZD on a 4H time frame.
Your target level should be a couple of pips below a supply zone.
That is a perfect target level.
Look how perfectly the market reached the target!
As you can see, that trading strategy is quite complex and combines different important elements. But what I like about this SMC trading strategy is that it truly makes sense.
The intentions of Smart Money are crystal clear here and the trade execution rules are straightforward.
❤️Please, support my work with like, thank you!❤️
I am part of Trade Nation's Influencer program and receive a monthly fee for using their TradingView charts in my analysis.
Education 
NOTUSDT: bullish spike toward $0.000600The Macro Picture 🗺️
Zoomed out to the full descent from the $0.0020 launch, NOT has spent eight months grinding into a macro base, with the floor at $0.000340 holding every test since February — a structural reset that demands the kind of deep, patient accumulation that precedes a real reversal. The early-June flush tagged that macro support once more, found no sellers beneath it, and reversed hard. Price now sits mid-impulse, pressing back up through the range with the $0.000340 floor freshly defended and momentum turning.
The Setup ⚙️
The Floor: The price box at $0.000340 marks the macro floor — tested in February, March, April and again in early June, and held on every occasion. The latest sweep beneath it triggered sell stops, cleared out over-leveraged shorts, and snapped straight back inside the range: a liquidity hunt, not a breakdown.
The Reaction: The bounce off the floor printed a sharp impulse leg rather than a hesitant drift, and RSI has snapped from the high-30s back toward 62 without yet reaching overbought — the path of least resistance now points up toward the unfinished business overhead.
The Roadmap: Primary target sits at $0.000600 — the Local High and first real overhead supply, where the May rejection left sellers waiting. The roadmap points there so long as the floor keeps holding. Invalidation: a sustained 1D close back below $0.000340 would invalidate this bullish thesis and confirm the macro floor has finally given way.