Education
Gold extends rebound:4365–4385 could be the first major barrier!With the US and Iran simultaneously confirming the first phase of their memorandum of understanding over the weekend, gold opened higher and continued to rise today, reaching a high of around 4345, effectively continuing the rebound momentum of the past two days. However, it should be noted that previous reports of an agreement have been repeatedly shattered, suggesting that instability may still exist before the agreement is finally confirmed and signed. Furthermore, the significant gap up and subsequent rise in gold prices today has already fully absorbed market optimism, so I believe there is not much room for gold to continue rising today.
Fundamental factors are currently overshadowing technical indicators, diminishing the latter's influence. However, in addition to technical factors, the short-term psychological resistance level lies in the 4365-4385 area, which is the recent top-to-bottom reversal zone. If gold fails to break through this resistance zone during the rebound, it may need to retest and confirm the support level before the market's bullish confidence can be strengthened. However, as gold continues its rebound, the current support level has also moved up to the 4300-4280 area.
Therefore, if gold continues its rebound and touches the 4360-4380 area for the first time, I will consider shorting gold; if gold retraces first and touches the 4305-4285 area, I will consider going long on gold. Long 
 Long
Long
ETHUSD structural reset: targeting $2,150The Macro Picture 🗺️
The June 5 mean-reversion thesis has played out with more conviction than projected — price first did a deeper sweep into $1,500, validating that level as the confirmed macro floor rather than a projection, then V-reacted with structural force back through $1,640 and into the $1,800 broken-floor supply pocket. RSI has snapped from sub-20 to ~50 in a clean recovery profile, and the entire capitulation move now reads as the structural reset that the multi-month descent desperately needed before any sustainable continuation higher could form. ETH is now sitting at the most important decision pivot of the recovery, with the broken macro floor directly overhead and the major resistance shelf at $2,150 marking the next structural target.
The Setup ⚙️
The Reaction: The V-shaped recovery off the $1,500 macro floor cleared every short parked beneath the early-June capitulation candle, and the speed of that bounce confirms structural buyers stepped in at the deeper liquidity pocket with real conviction. This is the textbook reset signature rather than a dead-cat profile.
The Support Flip: The $1,800 broken macro floor is now in play as the most important pivot of the entire recovery — a clean reclaim of this zone as support flips the structural lens from "back-test rejection" to "sustained reversal", opening the path toward the higher supply pockets above.
The Squeeze: Late shorts that piled in on the capitulation candle and the early-June continuation are now structurally trapped, providing the fuel for any breakout push through the broken-floor supply. Bears defending $1,800 desperately need to hold here or risk an accelerated unwind.
The Roadmap: Primary target sits at $2,150 — the major overhead resistance shelf where the former mid-range pivot from March through April aligns with the prior breakdown trigger zone. Invalidation: a sustained 1D close back below $1,640 would invalidate this reversal thesis and confirm the recovery was a textbook back-test rejection inside a larger bearish leg.  Long
Long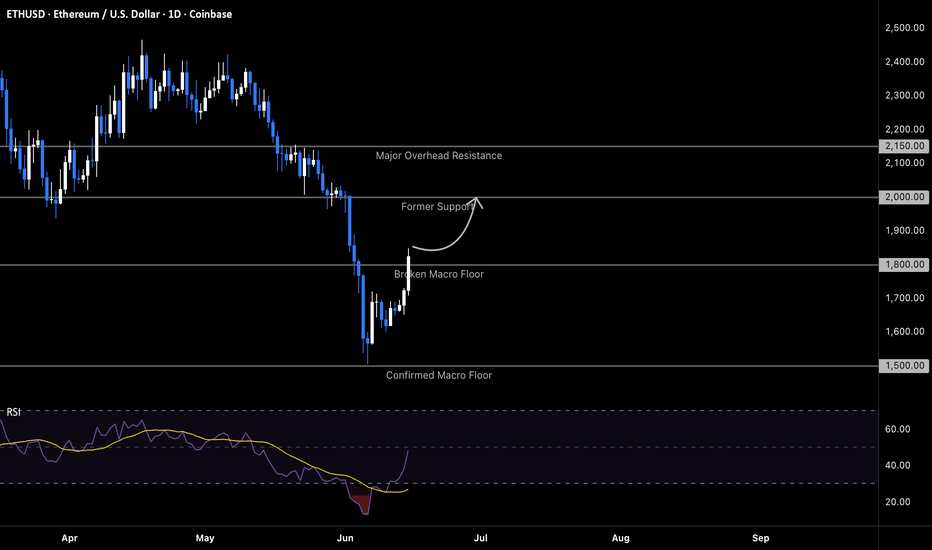
JUPUSDT critical pivot reclaim: targeting $0.220The Macro Picture 🗺️
The June 13 reversal thesis has played out almost exactly as mapped — price launched off the $0.144 macro floor sweep, recovered the full distance in two sessions, and a wide-range candle just tagged the $0.200 primary target. That target is no ordinary level: it capped the May 20 retest, was the failed support flip in late May, and was the line whose loss invalidated the June 3 continuation thesis. For the first time in the entire May–June chop, price is testing it from below with conviction. The character of the structure has shifted — the macro floor sweep marked the structural low, and a clean $0.200 reclaim is the first step toward reopening the upside path.
The Setup ⚙️
The Reclaim: A clean push through $0.200 turns the most-tested level on the chart from a brick wall into a structural floor. The fact that price required a full macro floor sweep before mounting this attempt suggests the level is being approached with cleared positioning, not the over-leveraged buying that capped the prior efforts.
The Consolidation: Acceptance above $0.200 is rarely a single-candle event at a level this contested — expect a few sessions of chop between $0.195 and $0.210 as the new support is stress-tested. This is the retest window, and a defended wick into $0.195 is the kind of higher-low confirmation that opens the next leg.
The Reaction: RSI has snapped from the mid-30s back into the upper 50s in eight sessions — a full momentum reversal without yet touching overbought. There is still runway for the move to extend before the indicator demands a cooldown.
The Roadmap: Primary target sits at $0.220 — the lower edge of the May overhead supply zone, where the original distribution shelf begins. Invalidation: a sustained 1D close back below $0.190 would invalidate this reclaim thesis and reopen the $0.165 retest as the next downside magnet, signaling that the $0.200 wall has held for the fifth time and the chop continues.  Long
Long
 Long
Long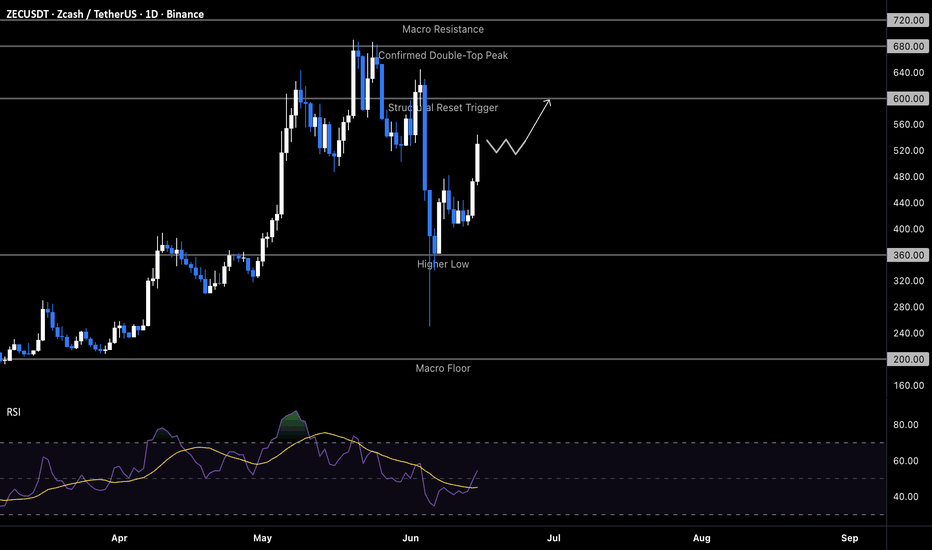
 Long
Long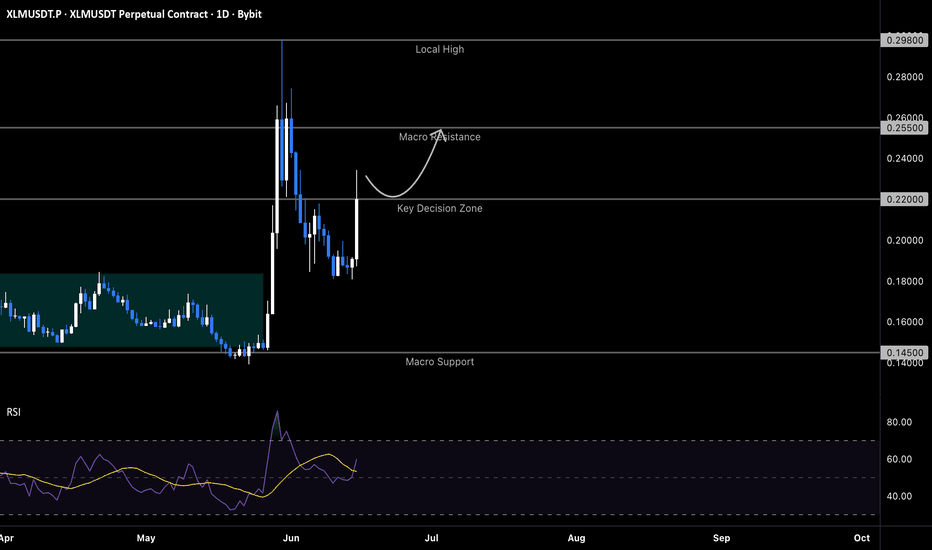
Long trade
📊 TRADINGVIEW IDEA PANEL — BTCUSDT.P
PAIR:
BTCUSDT.P
DIRECTION:
🟢 Buyside trade idea
DATE:
Mon 15th June 2026
SESSION:
Tokyo / Asia continuation into pre-market structure
ENTRY TIME:
7:00 PM
ENTRY:
60,782.6
STOP:
60,355.7
TARGET:
66,782.0
RR:
14.05
TIMEFRAME:
1-hour execution / 1-hour context
HTF BIAS:
🟢 Bullish recovery after sellside delivery into discount. Price formed a major base around the 59,800–60,300 zone, then reclaimed structure and delivered higher through multiple FVGs.
LIQUIDITY DRAW:
Buyside liquidity above current price, targeting the premium objective near 66,803.8.
SNAP MAP:
Discount recovery → fair-value mitigation → buyside continuation attempt.
Price swept/formed a base below 60,300, reclaimed fair value, respected the FVG ladder, and expanded toward the upper premium range.
TRIGGER:
Buyside continuation trigger after fair-value mitigation.
Price held above the recovery base, respected the FVG structure, and continued forming higher lows. The key confirmation was acceptance above the 65,043–64,693 fair-value zone, keeping the buyside programme active.
INVALIDATION:
60,355.7.
Trade is invalid if the price loses the recovery base and falls below the stop zone. A softer warning appears if the price loses 64,693 and fails to reclaim.
CONFLUENCES:
✅ Discount based on 59,800–60,300
✅ Fair value mitigated, not rejected
✅ FVG ladder supported the recovery
✅ Higher-low structure remained intact
✅ Price held above the original launch base
✅ Upside liquidity mapped at 66,803.8
✅ Buyside target aligns with premium objective
✅ Strong RR profile at 14.05
SENTIMENT / NEWS:
Macro sentiment is mixed-to-bullish short-term. Bitcoin recovered from the 60k base while broader risk appetite improved, but institutional demand and ETF-flow concerns mean the setup still needs confirmation above premium resistance. The chart supports a buyside recovery, but continuation becomes cleaner only if price holds above 65,043–64,693 and pushes through 65,700–66,000.
FINAL SNAP READ:
BTC delivered a clean discount-to-premium recovery. The trade idea remains valid while price holds above the fair-value support zone, with 66,803.8 acting as the main buyside draw.  Long
Long
 Long
Long
Long trade
📊 TRADINGVIEW IDEA PANEL — XAUUSD BUYSIDE SETUP
PAIR:
XAUUSD
DIRECTION:
🟢 Buyside trade idea
DATE:
Mon 15th June 2026
SESSION:
LND Session AM
ENTRY TIME:
5:20 am
ENTRY:
4341.45
STOP:
4328.96
TARGET:
4405.22
RR:
5.1
TIMEFRAME:
5-minute execution / 15-minute context
HTF BIAS:
🟢 Bullish recovery after strong sellside delivery into discount. Price formed a base at the lower range, reclaimed structure, and began building higher lows back through the TR Main Indicator recovery zone.
LIQUIDITY DRAW:
Buyside liquidity above price, targeting the upper range/premium objective around 4405.22.
SNAP MAP:
Markdown → discount accumulation → fair-value reclaim → buyside recovery expansion.
Price delivered aggressively into the discount, found support in the lower-demand area, then shifted structure with a bullish displacement. The recovery leg respected multiple bullish FVGs and continued holding above the TR Main Indicator support structure.
TRIGGER:
Buyside continuation trigger activated after price reclaimed fair value, held the FVG support zone, and continued forming higher lows above the TR Main Indicator cloud.
The 5-minute entry aligned with the 15-minute recovery map, confirming that the earlier sellside move had likely completed and the price was now repricing toward upper liquidity.
INVALIDATION:
4328.96.
Trade is invalid if the price loses the reclaimed FVG support area and falls below the recovery base. Early warning appears if the price breaks below 4334–4330 and fails to reclaim quickly.
CONFLUENCES:
✅ Discount base formed after sellside delivery
✅ Price reclaimed fair value
✅ Bullish FVG ladder supported the move
✅ TR Main Indicator shifted from resistance to support
✅ Higher-low structure confirmed recovery
✅ RSI remained constructive during the pullback
✅ London AM timing supported active expansion
✅ Target aligns with upper liquidity/premium resistance
✅ RR profile remains strong at 5.12
SENTIMENT / NEWS:
Gold remains sensitive to macro risk, dollar strength, yields, and safe-haven flows. The chart currently supports a technical recovery, but the trade should still be managed carefully as the price approaches premium resistance. A stronger dollar or rising yields could cap upside, while risk-off flows or renewed gold demand would support continuation.
FINAL SNAP READ:
XAUUSD reclaimed from discount, respected the TR Main Indicator recovery structure, and is targeting upper liquidity at 4405.37. The buyside idea remains valid while 4328.96 holds. Long 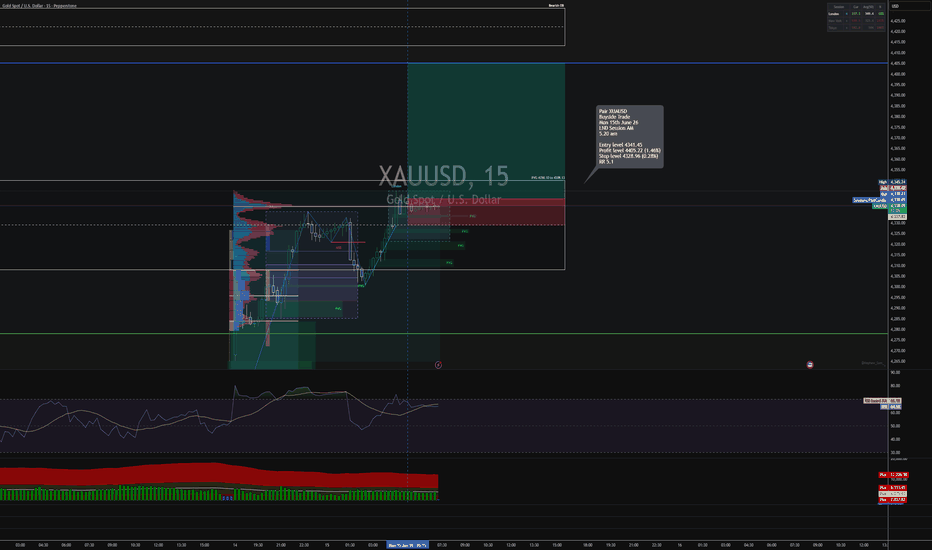
Long trade
📊 TRADINGVIEW IDEA PANEL — SUIUSDT BUYSIDE SETUP
PAIR:
SUIUSDT
DIRECTION:
🟢 Buyside trade idea
DATE:
Sun 14th June 2026
SESSION:
Tokyo Session PM
ENTRY TIME:
5:45 pm
ENTRY:
0.7778
STOP:
0.7750
TARGET:
0.8322
RR:
19.43
TIMEFRAME:
15-minute execution / higher-timeframe recovery context
HTF BIAS:
🟢 Bullish recovery after prior sellside delivery and extended basing. Price moved from a markdown environment into a broad accumulation range, then broke higher through the range ceiling with bullish displacement.
LIQUIDITY DRAW:
Buyside liquidity above price, targeting the premium objective at 0.8322. The target aligns with the upper projected range and prior imbalance/liquidity zone above the breakout.
SNAP MAP:
Markdown → accumulation range → fair-value reclaim → buyside displacement → continuation.
Price spent time building inside the lower-to-mid range, showing compression and balance after the prior selloff. The breakout above the range created a clear shift in delivery. Price then held above the breakout base and began forming a bullish continuation structure.
TRIGGER:
Buyside trigger activated after price broke above the accumulation range, reclaimed fair value, and held the breakout zone as support.
The entry at 0.7778 came after the price expanded away from the range and began respecting the new bullish structure. The stop at 0.7750 sits tightly below the breakout support / immediate invalidation zone, giving the trade a strong RR profile.
INVALIDATION:
0.7750.
Trade invalid if the price loses the breakout support and reverts to the prior range. A clean break back below 0.7750 would suggest the breakout failed, and price may rotate back into the old accumulation area.
CONFLUENCES:
✅ Prior markdown created discount conditions
✅ Broad accumulation range formed before expansion
✅ Range high was reclaimed
✅ Price shifted from balance into bullish displacement
✅ FVG structure supported continuation
✅ Entry aligned with breakout acceptance
✅ Stop placed below immediate invalidation
✅ Target aimed at upper liquidity/premium objective
✅ Strong RR profile at 19.43
SENTIMENT / NEWS:
SUI is behaving like a high-beta crypto recovery play. The technical chart shows strong recovery behaviour, but continuation still depends on broader crypto risk appetite and Bitcoin stability. If BTC remains supported and the crypto basket stays bid, SUI can continue attracting momentum flows toward the 0.8322 target. If broader crypto weakens, the tight invalidation below 0.7750 becomes important.
FINAL SNAP READ:
SUIUSDT broke out of accumulation, reclaimed fair value, and shifted into buyside delivery. The trade remains valid while 0.7750 holds, with 0.8322 acting as the primary buyside liquidity target.  Long
Long
 Long
Long
Long 
Short 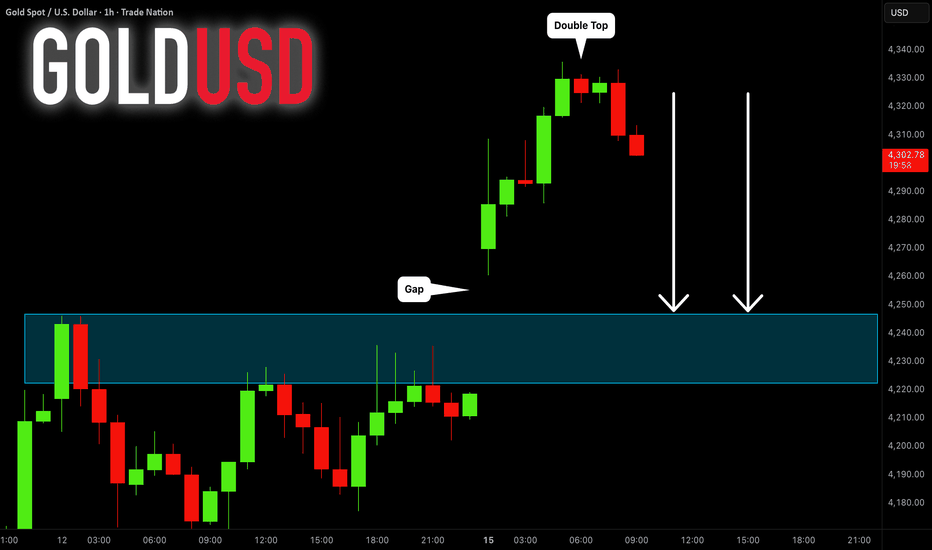
 Long
Long
 Short
Short
Long 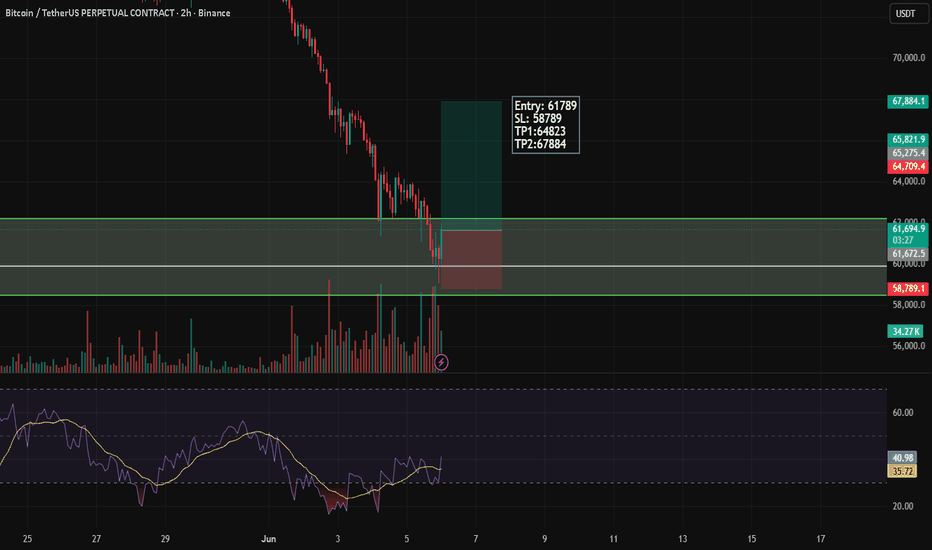
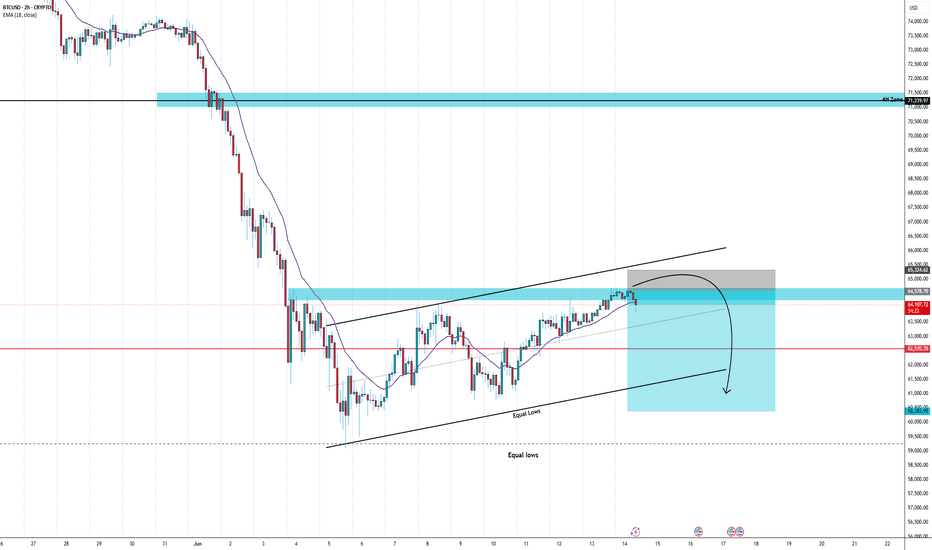
BTCUSDT post-sweep reclaim: targeting $68,000The Macro Picture 🗺️
The bearish continuation thesis from June 9 has shifted into structural suspension — the $59,000 sweep low held, price reclaimed the $60,000 macro floor without breaking it twice, and a bullish RSI divergence has now printed against the capitulation low. What looked like a textbook breakdown into open air is showing the structural signature of a sweep-and-reclaim instead, where the deepest reading since February's flush marked exhaustion rather than continuation. The recovery leg now faces its first real test at the $66,000–$68,000 supply zone — the broken range floor that desperately needs to be reclaimed before any structural reset narrative can take hold.
The Setup ⚙️
The Reclaim: The $60,000 macro floor was lost on June 6 but reclaimed within three sessions, neutralizing the breakdown signal — clean structural sweeps usually print one violation, not multiple, and the lack of follow-through below the floor reads as over-leveraged shorts getting trapped above the line.
The Divergence: RSI printed its lowest reading since the February capitulation while bouncing off the $59,000 wick — the classic bullish divergence signature that historically marks structural exhaustion at macro floors rather than continuation triggers.
The Decision Pocket: The $66,000–$68,000 supply zone is now the binary trigger on the chart. A clean reclaim flips the broken range floor back into support and reopens the structural path higher; a clean rejection sends price back toward the swept low and re-activates the June 9 thesis.
The Roadmap: Primary target sits at $68,000 — the broken range floor where prior demand from April's higher-low sequence now sits stacked as overhead supply, and the level that bears must defend to keep the larger downtrend intact. Invalidation: a sustained 1D close back below $59,000 would invalidate this bullish reclaim thesis and re-open the path toward $55,000 from the prior bearish read. Short