GOLD (XAU/USD): Your Plan to BuyGold is currently consolidating at a significant daily horizontal support level.
To initiate a long position upon confirmation, please await a bullish breakout above the specified intraday horizontal resistance.
An hourly candle close above 4150 will confirm the breakout.
Subsequent bullish momentum is projected toward the 4170 level.
Candlestick Analysis
GBPNZD Double Top at Resistance — Bearish Move Toward 2.3056?Hook:
FX:GBPNZD has pushed into a clear resi stance zone and printed a double top near the recent highs — with buy-side liquidity sitting above the equal highs . If sellers defend 2.3438–2.3473, the next major draw is the 2.3056 support / 0.618 Fib confluence. 🔥
Market Context:
GBPNZD has recovered strongly from the late-August/early-September lows, creating a sequence of higher highs and higher lows into the current resistance area.
However, the latest advance has stalled arou
XAU/USD 1H: Bearish Structure, Liquidity Sweep & Supply Zone RetXAU/USD Technical Analysis Report
Timeframe: 1H
Current Price: 4,142.27
1. Chart Structure & Trend
Trend: Bearish. The 1H chart shows a clear sequence of Lower Highs (LH) and Lower Lows (LL).
Break of Structure (BoS): Price aggressively broke below the Weekly Low (4,243.98), confirming strong bearish momentum.
Current State: Short-term consolidation/correction following an impulsive downward move. Price is currently forming a minor higher low, indicating a temporary exhaustion of sellers.
2.
EURGBP: Bullish After Liquidity Grab 🇪🇺🇬🇧
I see a valid sell-side liquidity grab on EURGBP on a test of a strong intraday support.
The price will likely pull back to 0.85876 level.
❤️Please, support my work with like, thank you!❤️
I am part of Trade Nation's Influencer program and receive a monthly fee for using their TradingView charts in my analysis.
TRXUSDT Analyses-55, September 28, 2026
Welcome to my page! I share daily technical analyses of crypto and other charts here.
BINANCE:TRXUSDT
🔍 Market Structure Analysis:
TRX remains bearish overall on the 1H chart, but the short-term structure has turned bullish after holding the 0.3329 support and breaking local swing highs.
🎯 Entry & Exit Signal:
Buy Entry: 0.3357
Stop Loss: 0.3345
Targets: 0.3381 R/R:2 - 0.3382 - 0.3414 - 0.3447 - 0.3490
Key Support & Resistance:
Key Resistance: 0.3382 / 0.3414 / 0.3447 / 0.3490
Key
SFR: distribution or just a pause at the highs?Initially I viewed this as a distribution event from the analysis that I set out below, but since the UK announced support for first time buyers and help to buy, I am wondering if this could support their sales? Maybe not, maybe there isn't that much steel that goes into homes, its mainly bricks and cement?
We could be seeing a very long period of distribution playing out with the steel fabricator Severfield. The price has essentially flatlined after a strong move from 28p to 38p. It’s now ver
GRAM/USDT | GRAM Jumps Nearly 30% , What's Next ? By analyzing the #GRAM chart on the weekly timeframe, we can see that after the previous analysis, price stabilized around the $1.33 area and then delivered a very strong bullish move toward $1.72 , gaining nearly 30% .
This move successfully reached our $1.45 and $1.60 targets and came very close to the $1.75 target as well. Definitely one of the cleaner GRAM moves we’ve had recently.
If you've been following these GRAM updates and found them useful, give this analysis a Boost to sup
NZDJPY: Bullish Move From Major Support 🇳🇿🇯🇵
NZDJPY tested a major daily support cluster today.
I see a clear sign of strength of the buyers on an hourly time frame after the NY session opening.
I expect a pullback to 89.36 level.
❤️Please, support my work with like, thank you!❤️
I am part of Trade Nation's Influencer program and receive a monthly fee for using their TradingView charts in my analysis.
USDJPY 4H: What Happens When Price Revisits This Supply Zone?Price is currently near an identified Supply Zone on the 4H timeframe.
This area is being observed because it originated from a strong imbalance following a Rally–Base–Drop structure. The zone is currently considered fresh , meaning price has not previously revisited the area after its formation.
Why is this zone technically significant?
A Rally–Base–Drop structure represents a sequence where price first moves upward, forms a relatively compact basing area, and then moves away sharply
GOLD (XAU/USD): Very Strong Bearish PatternThe price of 📉Gold is currently testing a firm daily horizontal support level.
The market formed a head and shoulders pattern on a daily time frame.
Please monitor how the price reacts to the neckline of this pattern.
Should a daily candle close below 4385, a bearish movement may be anticipated, with a target price of 4173.
USDCHF: Strong Intraday Bullish Price Action 🇺🇸🇨🇭
USDCHF looks bullish after the London session open.
The price violated a horizontal neckline of the ascending triangle pattern on a 4H time frame.
The market will likely rise further and reach 0.8332 level soon.
❤️Please, support my work with like, thank you!❤️
I am part of Trade Nation's Influencer program and receive a monthly fee for using their TradingView charts in my analysis.
From Narrative to Bias: Route, Event, DirectionA condensed reference on how price is delivered, how direction is established, and how traders are drawn onto the wrong side. The principles are stated for any period — a candle of whatever timeframe you trade — and for either direction. Clock times, session names and instruments are deliberately left out.
1. NARRATIVE — THE GAME PLAN OF PRICE DELIVERY
Definition. The narrative is an understanding of how the market will price an asset so as to do the most damage to traders who are positio
FARTCOINUSDT: Third Trendline Test — Another Rally Loading?Hook:
BINANCE:FARTCOINUSDT.P just bounced off the same rising trendline twice within nearly the same price — and the level it's now testing is the exact shelf that launched its last rally.
Market Context:
After a sharp impulse from ~0.14 to a spike high near 0.219, FARTCOINUSDT pulled back and has since defended an ascending trendline twice. Price is now pressing back into the 0.1850–0.1900 zone, the same shelf it consolidated on before that impulse leg.
Reasoning:
1- Trendline pro
If $83,000 Will Break We Short Until $80,000Bitcoin opened the week with aggressive selling, and the pressure is now sitting right on the break point support.
Why This Level Matters:
The weekend gap was already filled quickly on the lower timeframes. Price is now pressing into the 83,000 break point, the last support holding this range together.
Gameplan / Primary Scenario:
Sell the break of 83,000. As soon as price closes below and confirms the structure break, we are in short, targeting a continuation lower toward 80,000. Until th
EURCAD LONGMarket structure bullish on HTFs DH
Entry at both Weekly and Daily AOi
Weekly Rejection at AOi
Daily Rejection at AOi
Previous Structure Point Daily
Daily EMA retest
Touching EMA H4
H4 Candlestick rejection
Rejection from Previous structure
TP: WHO KNOWS!
Entry 100%
REMEMBER : Trading is a Game Of Probability
: Manage Your Risk
: Be Patient
: Every Moment Is Unique
: Rinse, Wash, Repeat!
: Christ is King
EURAUD LONGMarket structure bullish on HTFs 3
Entry at both Weekly and Daily AOi DW
Weekly Rejection at AOi
Weekly Previous Structure Point
Daily Rejection at AOi
Previous Structure point Daily
Around Psychological Level 1.61500
Touching EMA H4
H4 Candlestick rejection
Rejection from Previous structure
TP: WHO KNOWS!
Entry 120%
REMEMBER : Trading is a Game Of Probability
: Manage Your Risk
: Be Patient
: Every Moment Is Unique
: Rinse, Wash, Repeat!
: Christ is King
EURCHF LONGMarket structure bullish on HTFs 3
Entry at Weekly and Daily AOi
Weekly Rejection At AOi
Previous Weekly Structure Point
Daily Rejection At AOi
Previous Daily Structure Point
Around Psychological Level 0.94000
Touching EMA H4
H4 Candlestick rejection
Rejection from Previous structure
TP: WHO KNOWS!
Entry 120%
REMEMBER : Trading is a Game Of Probability
: Manage Your Risk
: Be Patient
: Every Moment Is Unique
: Rinse, Wash, Repeat!
: Christ is King
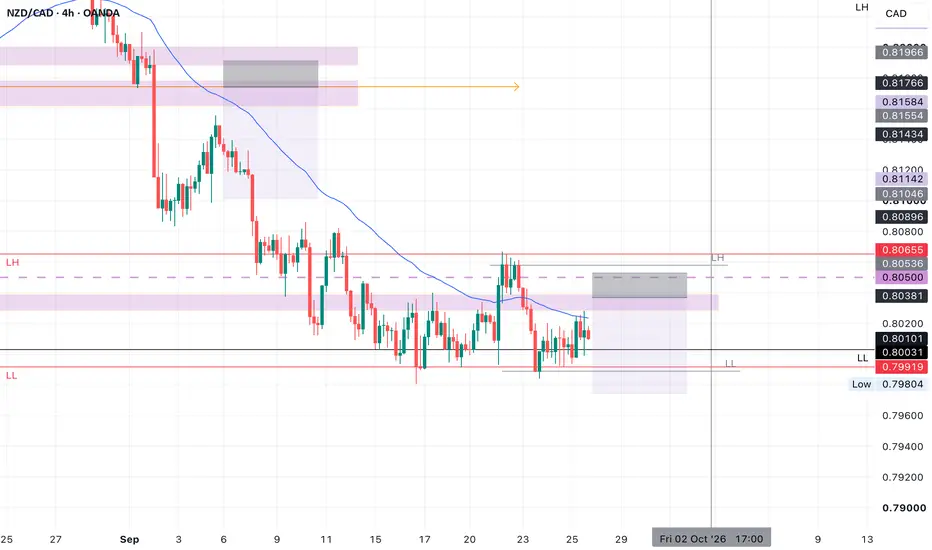
NZDCAD SHORT Market structure bearish on HTFs 3
Entry at both Weekly and Daily AOi
Weekly Rejection At AOi
Daily Rejection At AOi
Previous Structure Point
Previous Structure point Daily
Around Psychological Level 0.80500
Touching EMA H4
H4 Candlestick rejection
Rejection from Previous structure
TP: WHO KNOWS!
Entry 120%
REMEMBER : Trading is a Game Of Probability
: Manage Your Risk
: Be Patient
: Every Moment Is Unique
GBPCAD SHORTMarket structure bearish on HTFs 3
Entry at both Weekly and Daily AOi
Weekly Rejection at AOi
Previous Weekly Structure Point
Daily Rejection at AOi
Previous Daily Structure Point
Daily EMA retest
Around Psychological Level 1.87500
H4 Candlestick rejection
Rejection from Previous structure
TP: WHO KNOWS!
Entry 120%
REMEMBER : Trading is a Game Of Probability
: Manage Your Risk
: Be Patient
: Every Moment Is Unique
: Rinse, Wash, Repeat!
: Christ is King
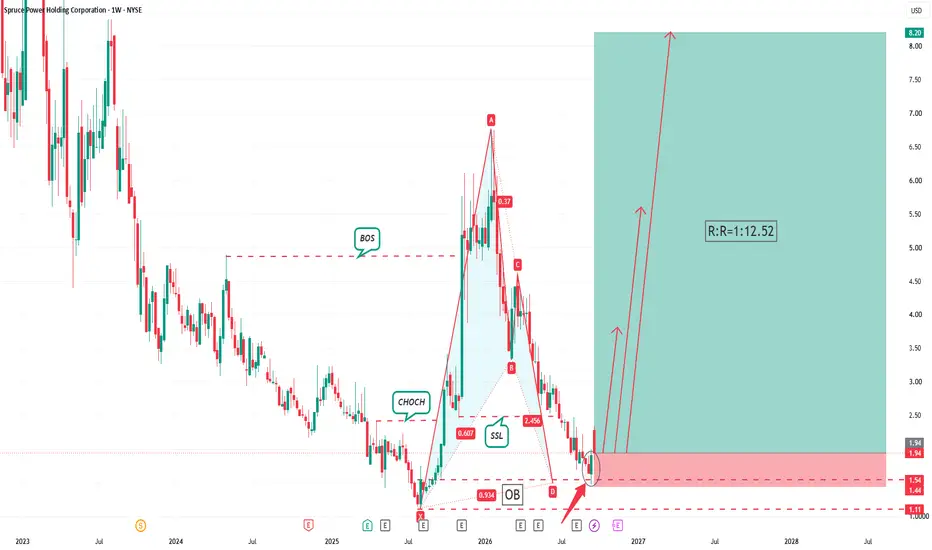
Trading Plan: SPRUTrading Plan: SPRU
Time Frame: Weekly Swing Trade
Trade Direction: Long
Entry Price: Around $1.94
Stop Loss: $1.44
Risk-Reward Ratio: 1:12.52
Targets & Trade Management:
1. First target at $3.82: Close half of position, move stop loss to lock in profit.
2. Second target at $5.60: Close half of remaining position, move stop loss to lock in profit.
3. Third target at $8.20: Close half of remaining position, move stop loss to lock in profit.
Trail stop loss for the remaining position.
Risk Wa
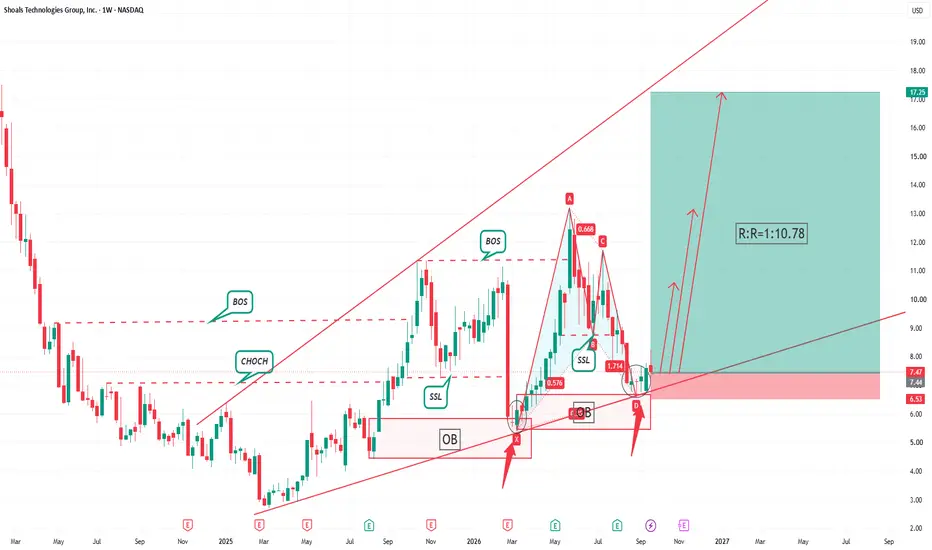
Trading Plan: SHLSTrading Plan: SHLS
Time Frame: Weekly Swing Trade
Trade Direction: Long
Entry Price: Around 7.47
Stop Loss: 6.50
Risk-Reward Ratio: 1:10.78
Targets & Trade Management:
1. First target at 10.60: Close half of position, move stop loss to lock in profit.
2. Second target at 13.20: Close half of remaining position, move stop loss to lock in profit.
3. Third target at 17.30: Close half of remaining position, move stop loss to lock in profit.
Trail stop loss for the remaining position.
Risk Warn