AUDUSD: The Top That Wasn'tTwo moments on the AUDUSD 6-hour chart, worth putting side by side.
Moment one: price rallied to 0.72079, pulled back hard to 0.71260 — a drop of over 80 pips — then rallied right back to 0.72081, essentially matching the first high to the pip. On paper, that's about as textbook a double top as charts produce: two equal peaks, a deep trough between them, the kind of structure that usually precedes a reversal.
Moment two: it didn't reverse. A few sessions later price pushed straight through both peaks and printed a fresh high at 0.72378, higher than either top in the pattern. The "resistance" the double top implied simply wasn't there when it mattered.
What's the difference between the setup that failed and the move that worked? Volume gives a partial answer — the breakout bar that cleared the pattern traded on above-average volume, while the second peak of the double top itself came in comparatively quiet. The pattern looked right; the participation behind it wasn't.
Since that new high, price has pulled back to 0.7167, giving up roughly 90 pips in a handful of bars. Whether this pullback behaves like the first one (a pause before another leg higher) or the second (an actual top) probably comes down to the same thing — whether the next move up, if it comes, brings volume with it or not.
Not a setup call either direction, just two comparable moments on the same chart with very different endings.
Educational analysis only. FX moves fast — treat any chart pattern as a probability, not a promise. PAX GOLD BEARISH SETUP: IS ANOTHER DROP TOWARD THE LOWS COMING?Yello Paradisers! are #PAX Gold bulls about to get trapped before another strong move to the downside? Price action is currently showing a high-probability bearish setup, supported by both market structure and Dow Theory.
💎#PAX Gold first formed a clear Double Top pattern, followed by a decisive break of market structure. After that breakdown, price created another Lower Low, confirming that sellers remain in control and that the broader short-term structure is still bearish.
💎Right now, price is correcting the latest bearish impulse and has retraced into the 0.78 Fibonacci level. This is an important area because price reacted strongly from it and then formed another Lower Low on the smaller timeframe.
💎That lower-timeframe confirmation shows clear rejection from the retracement zone and further strengthens the probability that the correction is ending.
💎As long as the current bearish structure remains intact, we can expect price to continue moving lower toward the previous low, which is also acting as an important support zone and the most logical downside target for this setup.
💎The bearish scenario will be invalidated if price breaks and closes above the previous swing high, as that would signal that sellers are losing control and the current market structure is changing.
The key here is not to chase the move. The highest-probability trades come from waiting for confirmation, respecting invalidation levels, and allowing the market structure to do the work. Discipline and patience will always outperform emotional execution over the long run.
MyCryptoParadise
iFeel the success🌴
 Short
Short
SELL STOP / BREAKOUT SIGNAL: XAU/USD (Gold Spot)A decisive breakdown below the key 4,608.00 support level will confirm a high-probability bearish continuation, aligned with higher-timeframe resistance, a top reversal pattern, and structural market shifts.
Execution & Order Details
Order Type: Sell Stop / Breakdown Entry
Entry Trigger: 4,608.00 (Triggered on a strong 15-minute candle close below support)
Stop Loss (SL): 4,628.00 (Placed above the broken horizontal support/flip zone; risk ~200 pips)
Take Profit 1 (TP1): 4,563.50 (Primary demand zone & previous swing low)
Take Profit 2 (TP2): 4,502.50 (Key intermediate structural support)
Take Profit 3 (TP3): 4,450.80 (Macro 4-Hour liquidity pool & extension target)
Risk/Reward Ratio: ~1:2.2 to TP1 | ~1:5.2 to TP2 | ~1:7.8 to TP3
Comprehensive Technical Breakdown
4-Hour Rejection Zone: On the 4-hour timeframe, price action displays heavy institutional selling pressure near the $4,680–$4,690 resistance highs. Repeated long upper wicks highlight a distinct supply zone, indicating buyer exhaustion and strong seller defense.
Double Top Formation: A prominent Double Top chart pattern has formed at the upper boundary. The failure of buyers to print higher highs confirms an distribution phase before a potential sharp markdown.
Market Structure Shift (MSS): The horizontal level at 4,608.00 serves as the major structural neckline. A clean breakdown below this level invalidates the bullish order flow and shifts the lower-timeframe market structure cleanly to bearish.
Moving Average Confluence: Price is trading beneath the 100-period Exponential Moving Average (100 EMA) on the intraday chart, reinforcing downward momentum once the key support breaks.
Trade & Risk Management Rules
Confirmation First: Do not market execute prematurely; wait for price action to break and close below 4,608.00 or retest the level as new resistance.
Partial Take Profits: Lock in partial profits (e.g., 50%) at TP1 (4,563.50) and move the Stop Loss to Breakeven to risk-free the trade.
Position Sizing: Maintain strict risk management (1–2% total account equity risk max).
Disclaimer: This post is for educational and informational purposes only and does not constitute financial, investment, or trading advice. Always conduct your own research, use proper risk management, and trade at your own discretion.
#XAUUSD #GoldTrading #TradingSignal #ForexSignals #SmartMoneyConcepts #MarketStructureShift #DoubleTop #PriceAction #GoldStrategy #TechnicalAnalysis #TradingView  Short
Short
 Long
Long
 Long
Long
S&P 500 Weekly Outlook – Double Top Forming? (July 19, 2026)Jul. 19 – Back in May, we were watching the S&P 500 reclaim key resistance and continue its recovery. That breakout carried the index to fresh highs, but the market has now reached another major decision point.
Price is testing the previous highs around 7,620, creating the potential for a double top while also forming a rising wedge a pattern that often signals buyers are losing momentum as price pushes higher.
📍 Key Levels
7,620 = Major resistance and potential double-top confirmation.
Rising wedge support = Bulls need to defend this trendline to keep the uptrend intact.
Break above 7,620 = Invalidates the bearish setup and opens the door for another leg higher.
Break below the rising wedge = Could signal the first meaningful correction since the April recovery.
📉 Downside Targets
6,645 – Gap-fill area (~12.7% below the highs).
6,318 – March support (~20.4% below the highs). Losing this level would confirm a much larger correction.
At the moment, the bearish pattern has not been confirmed. As long as price remains inside the wedge, both outcomes remain possible. The next move from this area should determine whether the S&P 500 breaks out to new highs or begins its first significant pullback in months.
Not Financial Advice. This is my technical analysis based on price action and chart structure.  Short
Short
 Short
Short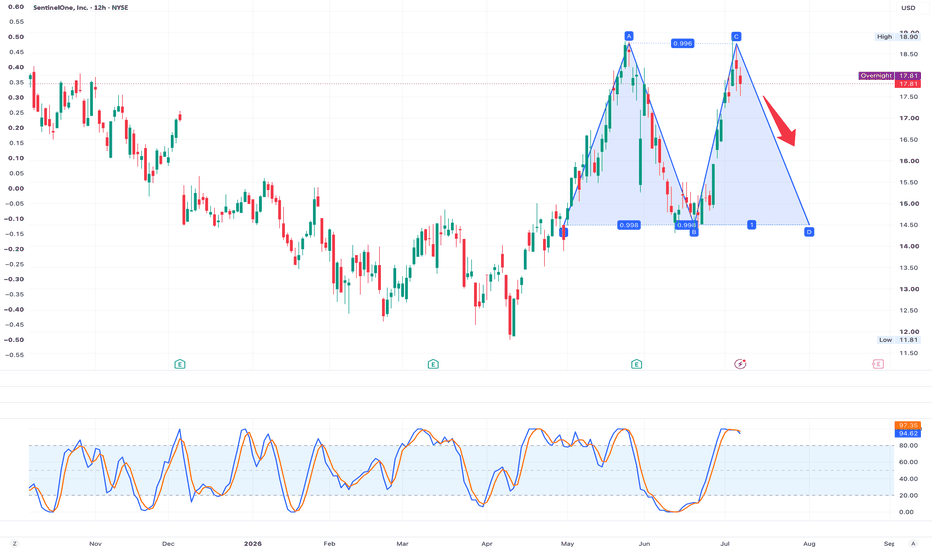
 Short
Short
Long 
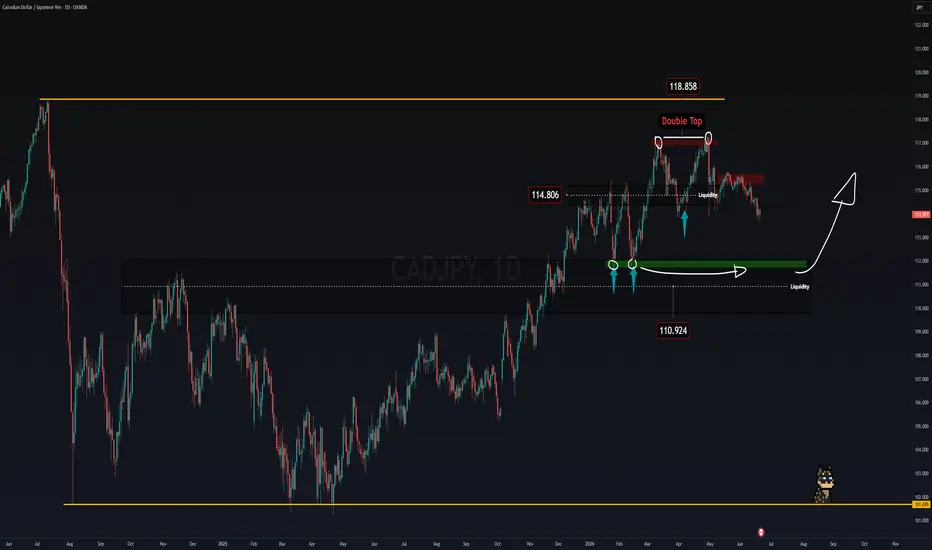
USDCHF: Risky Reversal Play with Significant Upside PotentialDouble Top
This pair formed a notable double top around 1.00600 during the latter part of 2022 before opening gates for a prolonged decline, eventually reaching 0.83326 roughly a year later.
The Trading Range
Throughout 2024, price action was largely confined to a broad trading range, roughly between 0.83900 and 0.92250. That balance was finally disrupted in April 2025 when the lower end of the range was taken out, triggering another leg lower that carried the pair down to 0.76038 in January 2026.
Early Change in Character
Since those January lows, however, the character of the chart has begun to improve. The pair has managed to establish a higher low followed by a higher high on the weekly timeframe, often one of the earliest signs that sellers are losing control and a trend reversal may be taking shape.
Inverted Head and Shoulders
The structure also bears a strong resemblance to an inverted Head & Shoulders pattern, with the neckline already broken to the upside. While no pattern guarantees success, this is typically viewed as a constructive development and suggests that buyers are becoming increasingly willing to absorb supply at higher prices.
Flipping Role Concept
An equally important technical factor is the concept of support and resistance role reversal. The former range floor near 0.83746, which previously acted as support before the breakdown in 2025, is now likely to be watched as a key resistance zone. Markets frequently revisit such levels as participants reassess value, and if price can reclaim and hold above that area, it would strengthen the case for a broader recovery. Such former resistance levels, once taken out, can also flip into support providing a foundation for further advances.
The Trade's Potential
For traders willing to take a contrarian stance, this presents an interesting, albeit higher-risk, reversal opportunity. Initial upside potential lies towards the previous range boundary around 0.83746, while a successful reclaim of that level could open the door to a move towards 0.92244.
Protection
Given the early-stage nature of the reversal, risk management remains crucial. A logical protective stop would sit below the most recent higher low at 0.77618, as a break beneath that level would undermine the developing bullish structure.
What is your take on this pair?
Do comment and boost for more ideas in future. WMT | The Mirage of All-Time Highs, The Looming 33% Drop | SHORTThe retail king looks unstoppable. Trading up near the $117–$120 range, NASDAQ:WMT has been heralded as the ultimate consumer-defensive safe haven. The financial media is singing its praises, cheering on AI integrations and its third-party marketplace.
But if you look under the hood with a trader’s eye, the chart is telling a completely different story. While price has been painting a beautiful picture of higher highs, the momentum and internal metrics are flashing a massive, terminal Bearish Divergence.
Here is why Walmart is priced for perfection, and why a technical and fundamental air pocket is about to drop this stock by at least one-third of its value before the year is out.
1. The Technical Setup: Extreme Bearish Divergence
As a divergence seeker, this is the classic "textbook" trap.
The RSI Split: While Walmart's price aggressively pushed toward its 52-week high of $135 earlier this year, the Relative Strength Index (RSI) refused to follow, printing a stark sequence of lower highs.
The MACD Rollover: On the weekly chart, the MACD (Moving Average Convergence Divergence) has already experienced a bearish crossover in negative territory. Price is currently clinging to the EMA50, but volume profiling shows thin support below $115. Once that breaks, there is a vacuum down to the $80-$90 structural demand zone.
2. Fundamental Divergence: The P/E vs. Growth Paradox
The biggest divergence isn't just on the chart—it’s between Walmart’s reality and its valuation. Walmart is currently trading at a Price-to-Earnings (P/E) ratio of over 41x.
Trefis
For a mature, massive-cap retail brick-and-mortar giant, a 41x multiple is traditionally reserved for high-flying tech companies, not a business growing its top-line revenue at roughly 4-5% year-over-year.
The market has priced in high-margin alternative revenue streams—like its retail media network, Walmart Connect—as if they already dominate the bottom line. If consumer spending faces even a mild macro slowdown in the second half of the year, a multiple compression from 41x back down to a historically reasonable 25x implies an immediate 35-40% drop in share price, bringing it squarely back to the $80 level.
3. Smart Money is Quietly Distribution Modeling
While retail investors are buying the breakout narrative, the ultimate insiders are hitting the exit button.
Just this month, the Walton Family Holdings Trust executed massive open-market sales, liquidating millions of shares in the $120–$122 range. When the founding family and largest insiders decide that $120+ is a great place to trim their exposure and distribute shares, it’s a glaring signal that the stock has outrun its fundamental fair value. Insiders sell for many reasons, but they rarely distribute in bulk if they believe a stock is still wildly undervalued.
Stock Titan
The Trade Plan
The Trigger: A clean weekly close below the major psychological and technical support at $115.
The Target: The structural support zone between $78.00 and $82.00 (representing a ~33% correction from current levels).
Invalidation: A macro-fueled push that invalidates the weekly divergence, closing and holding above $135.50.
Bottom Line: Don't chase the retail hype at the top of a parabolic, multiple-expanded run. The metrics are diverging, the insiders are selling, and the chart is heavily top-heavy. Protect your capital.  Short
Short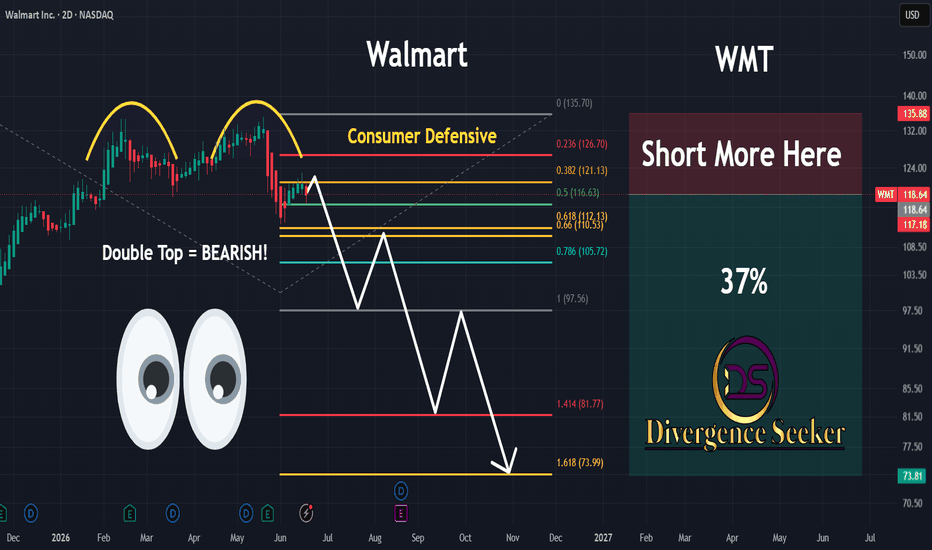
Short 
 Short
Short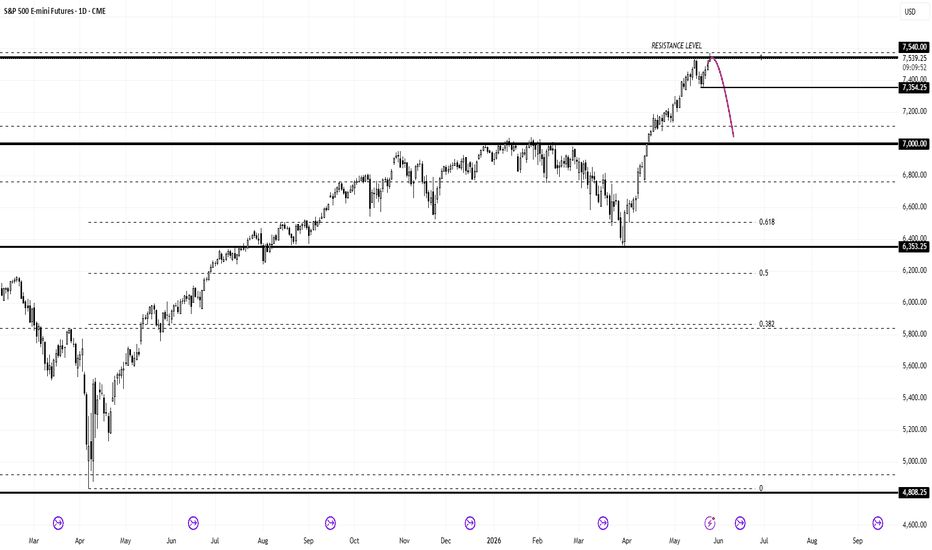

 Short
Short

 Short
Short