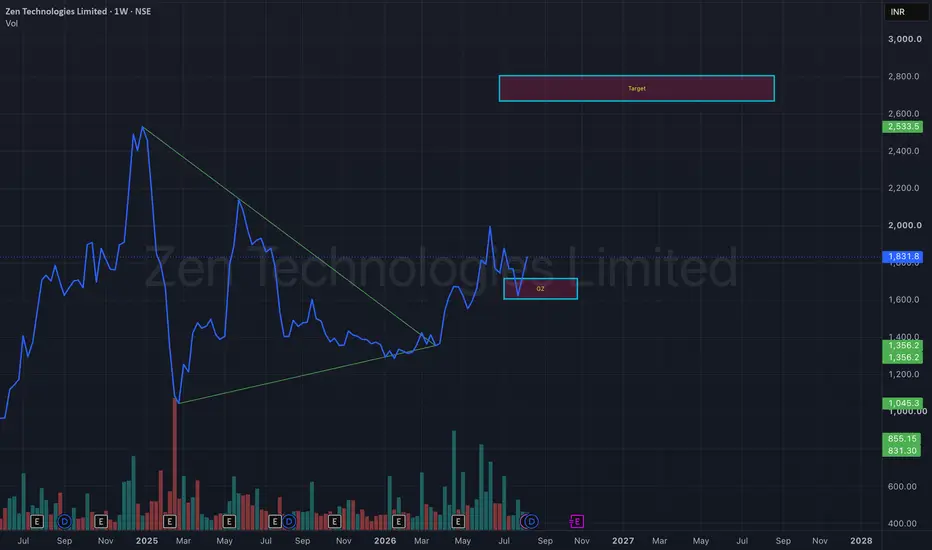
Zen Technologies: Symmetrical Triangle Breakout LoadingZen Technologies has been consolidating within a Symmetrical Triangle on the weekly timeframe, following a sharp rally and subsequent correction. The narrowing price range indicates that both buyers and sellers are reaching equilibrium, often leading to a strong directional move once the pattern resolves.
The recent breakout above the upper trendline suggests buyers are attempting to regain control, while the former resistance zone now acts as a key demand area.
📊 Technical Highlights
✅ Symmetrical Triangle breakout
✅ Higher lows indicate improving buying interest
✅ Breakout backed by strong weekly momentum
✅ Price holding above the breakout zone
✅ Volume expansion supports the bullish outlook
📍 Key Levels
Breakout Zone: ₹1,650–1,700
Immediate Support: ₹1,600
Major Support: ₹1,350–1,400
🎯 Bullish Scenario
If price sustains above the breakout zone with continued buying interest, the next leg of the uptrend could unfold.
Potential Targets:
🎯 Target 1: ₹2,100
🎯 Target 2: ₹2,350
🎯 Target 3: ₹2,700–2,800
⚠️ Risk
A weekly close back below ₹1,600 would invalidate the breakout and could lead to a retest of the ₹1,350–1,400 demand zone.
Technical Summary
Pattern: Symmetrical Triangle Breakout
Trend: Long-Term Bullish
Timeframe: Weekly
Confirmation: Weekly close above ₹1,700 with strong volume
Bias: Bullish while above the breakout level
Disclaimer:
This analysis is for educational purposes only and should not be considered investment advice. Always perform your own research and use proper risk management before making investment decisions.  Long
Long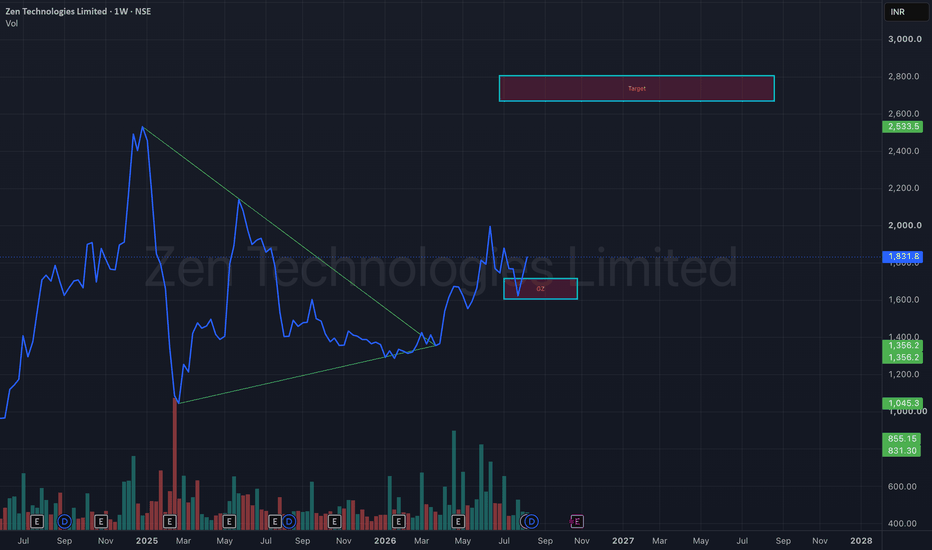
Trading Roadmap| Wave Analysis·Lesson 06— Fibonacci with ElliottLesson 6 - Fibonacci with Elliott
Difficulty: (Intermediate)
Wave counting tells you where you are in the structure. Fibonacci tells you how far the next leg might travel. On their own, each one leaves a gap — a count with no measurement, or a set of levels with no context. Used together, they answer two different questions at the same time.
A completed five-wave advance followed by an A-B-C correction. Before any measurement is added, the count has to survive the rules from Lesson 4 — Wave 2 held above the start of Wave 1, Wave 3 is the longest motive leg, and Wave 4 stayed well clear of Wave 1's territory. Everything that follows is measured on this same sequence.
🔵 QUICK RECAP FROM LESSON 5
Each wave tends to carry its own character — Wave 3 broad and heavily participated, Wave 4 slow and sideways, Wave 5 making a new extreme on thinner conviction.
Personality helps you rank counts that all remain valid. This lesson adds the measuring layer: once a count is chosen, where might the next leg reasonably reach, and where would the whole idea stop making sense.
🔵 1. WHY THE TWO FRAMEWORKS SIT TOGETHER
Elliott's structure describes sequence — which leg comes next and what shape it usually takes. Fibonacci ratios describe proportion — how the legs tend to relate in size.
Neither one predicts. Both give you a framework to prepare with.
- A count without measurement gives you direction but no target and no defined risk
- Levels without a count give you a grid of prices with no reason to prefer one over another
- Together, they let you say: if this is a Wave 4, this zone matters, and this level would invalidate it
If you have not read Classical TA · Lesson 12 on drawing Fibonacci, this lesson assumes you can already place a retracement correctly.
🐳 Pro Tip: Fibonacci does not confirm a count. If the three rules from Lesson 4 are broken, no ratio hit repairs it.
🔵 2. THREE TOOLS, THREE DIFFERENT JOBS
A lot of confusion around Fibonacci in wave analysis comes from mixing up which tool does what.
- Retracement (two points) — measures how much of a completed leg is given back. Used for Wave 2, Wave 4 and Wave B
- Projection / Trend-Based Extension (three points) — measures a completed leg and projects that distance forward from a different starting point. Used for Wave 3, Wave 5 and Wave C
- Extension beyond 100% — the same projection tool, read above 1.0, for legs that travel further than the one they are measured against
Retracement looks backwards inside a move. Projection looks forwards from the end of a correction. Using the wrong one is one of the more common reasons targets come out looking strange.
🐳 Pro Tip: Before you draw anything, say out loud which question you are asking. "How much was given back" is a retracement. "How far might this run" is a projection. The tool follows from the question, not the other way round.
🔵 3. WAVE 2 — RETRACEMENT ZONES
Wave 2 is measured against Wave 1, from the start of Wave 1 to its end.
- 50% – 61.8% is the zone that comes up most often
- 78.6% appears regularly on sharper second waves and is still perfectly valid
- Shallower second waves — around 38.2% — do happen, and they are worth a second look rather than an automatic rejection
- Anything beyond 100% breaks Rule 1 from Lesson 4 — at that point the count needs rethinking, not stretching
Wave 2 here bottomed just past the 38.2% line — shallower than the area that comes up most often. The count still stands, because validity is decided by the rule, not the ratio: the 100% line sits at the origin of Wave 1 and was never approached. Ratios describe tendencies; rules decide.
🐳 Pro Tip: The 100% line of your Wave 2 retracement is also your invalidation level. Drawing the retracement gives you the target zone and the risk boundary in the same action.
🔵 4. WAVE 4 — THE SHALLOWER SIDE
Wave 4 is measured against Wave 3, and it typically retraces far less than Wave 2 did.
- 23.6% – 38.2% is the range most commonly cited
- 50% shows up on deeper fourth waves and does not break anything on its own
- The Wave 1 high still marks the boundary from Rule 3 — a retracement zone that sits inside Wave 1 territory is a warning that the count may need a different degree
This is where alternation from Lesson 5 becomes practical: when Wave 2 is sharp, a shallow and sideways Wave 4 is the more typical companion.
Wave 4 turned almost exactly on the 23.6% line — the shallow edge of the range described above, and a long way from Wave 1's territory. Compared with the second wave, the two corrections in this sequence gave back very different amounts of the leg before them.
🐳 Pro Tip: If a supposed Wave 4 retraces more than roughly 50% of Wave 3, it is worth testing an alternative count before assuming the impulse is still intact.
🔵 5. WAVE 3 — PROJECTING FORWARD
Wave 3 is projected from Wave 1: measure Wave 1, then anchor the projection at the end of Wave 2.
- 1.618 of Wave 1 is the ratio most often associated with a third wave
- 2.618 and beyond appear when Wave 3 is the extended wave — the subject of Lesson 7
- A Wave 3 that fails to exceed 1.0 of Wave 1 is unusual, and combined with Rule 2 it is worth double-checking
Treat these as zones to watch rather than exit prices. Third waves are the legs most likely to run past a projection, which is precisely why holding a position through one is difficult.
The third wave passed 1.618 without pausing and stalled a little under 2.618. Neither line was touched precisely — which is the normal outcome. A projection marks an area where the leg may begin to run out of room, not a price where it has to stop.
🐳 Pro Tip: When Wave 3 reaches 1.618 and momentum stays broad, that is not automatically a top — it is a level where partial management can be considered while the structure keeps its own count.
🔵 6. WAVE 5 — PROJECTING THE FINAL LEG
Wave 5 is most commonly measured against Wave 1: take Wave 1's length and project it from the end of Wave 4.
- 1.0 — equality with Wave 1 — is the reading used most often, and comes up frequently when Wave 3 was the extended wave
- 0.618 is common when Wave 5 is running on thinner participation
- An alternative approach measures from the start of Wave 1 to the end of Wave 3, then projects 0.382 or 0.618 of that distance from the Wave 4 low
When two approaches point at a similar area, that area is worth marking. When they are far apart, the count may be at a different degree than assumed.
Equality with Wave 1 landed inside the range where the advance began to stall, and the final high came a little above it. That overshoot is ordinary — these projections describe where a leg may be maturing, not a ceiling it is obliged to respect.
🐳 Pro Tip: Pair the Wave 5 projection with the momentum divergence from Lesson 5. Neither is a signal alone; together they describe a sequence that may be maturing.
🔵 7. MEASURING THE CORRECTION — A, B AND C
The A-B-C structures from Lesson 3 respond to the same tools.
- Wave B in a zigzag commonly retraces 38.2% – 61.8% of Wave A; in a flat it can reach 90% or more
- Wave C is usually projected from Wave A: 1.0 (equality) and 1.618 are the two readings most often used
- When Wave C reaches equality with Wave A near a retracement level of the larger impulse, that overlap is the kind of confluence worth marking on the chart
🐳 Pro Tip: A "B wave" that retraces more than 100% of A is not necessarily wrong — but the labels may need to move. Expanding flats are covered later in the course.
🔵 8. WHERE, AND WHEN
Fibonacci answers where might this leg reach . It does not answer has the turn actually happened . For that, most traders reach for something structural — and a trendline is the simplest version of it.
Two places it shows up in a wave sequence:
- Ending an impulse: a rising line along the pullback lows inside Wave 5. While it holds, the fifth wave is still building. When it gives way, the first corrective leg is often already underway — which is usually how a Wave A gets identified in real time rather than in hindsight
- Ending a correction: a descending line along the highs of the A-B-C. A break above it can be the first sign the correction may be complete, and it tends to arrive before any wave label can be confirmed
The rising line that had been holding the pullbacks inside Wave 5 gave way shortly after the high. The projection had already marked the area; the break is what turned it into something you could act on.
Neither break confirms a count on its own. What they add is timing — the projection gives you the area, the break gives you a moment to react to.
The same idea applied to the correction. While this descending line holds, the A-B-C can still be extending; a decisive move above it would be the first structural argument that the correction may be finishing.
🐳 Pro Tip: The projection and the trendline break rarely happen at the same instant. When the break comes far from any zone you had marked, it is more likely noise. When it comes inside that zone, the two are describing the same event from different angles.
🔵 9. CONFLUENCE WITHOUT LEVEL-HUNTING
The risk with Fibonacci is that enough levels on a chart will eventually cover every price. A few habits keep it disciplined.
1. Draw only the measurement the current question needs — one retracement or one projection, not five
2. Prefer zones where a Fib level overlaps something independent: a horizontal level from prior structure, a channel boundary, a moving average
3. Keep the invalidation levels from Lesson 4 visible at all times
4. Remove drawings that belong to a count you have already discarded
A level that matters usually has a reason to matter beyond the ratio itself.
🐳 Pro Tip: Horizontal levels built from prior structure are useful here precisely because they come from something other than wave ratios. When a retracement zone lands on a level that was already on the chart before you measured anything, the two are agreeing independently — a more meaningful kind of agreement than stacking more ratios on top of each other.
🔵 COMMON MISTAKES
- Using a retracement where a three-point projection is needed, or the reverse
- Anchoring a Wave 3 projection at the start of Wave 1 instead of the end of Wave 2
- Treating a ratio hit as confirmation while a rule from Lesson 4 is already broken
- Discarding a valid count because a retracement came in shallower or deeper than expected
- Leaving every Fibonacci level on the chart until nothing stands out
- Expecting exact touches — ratios describe zones, and overshoots are normal
- Adjusting the anchors after the fact so the level matches where price already went
🔵 QUICK SELF-CHECK
- Explain in one sentence when you would use a retracement and when you would use a projection
- Open a completed impulse and measure how much of Wave 1 the second wave gave back
- On the same chart, check where Wave 3 landed relative to 1.618 and 2.618
- Project Wave 5 from the Wave 4 low and see how close equality came to the actual high
- Draw the line along the Wave 5 pullback lows and find where it broke
- Identify the single level that would invalidate the count
🔵 WHAT IS NEXT
Lesson 7 — Extended Waves: one motive wave in an impulse is usually longer than the others. We look at which wave tends to extend, what changes when it does, and how the measurements in this lesson shift once an extension is underway.
Which Fibonacci measurement do you rely on most — and which one has misled you?
Full Trading Roadmap | Wave Analysis Course
Trading Roadmap | Wave Analysis · Lesson 01 — Wave Analysis Foundations
Trading Roadmap | Wave Analysis · Lesson 02 — Impulse Waves (5-Wave Structure)
Trading Roadmap | Wave Analysis · Lesson 03 — Corrective Waves (A-B-C)
Trading Roadmap | Wave Analysis · Lesson 04 — The Rules of Elliott
Trading Roadmap | Wave Analysis · Lesson 05 — Wave Personality
Best Regards, BigBeluga 🐳  Education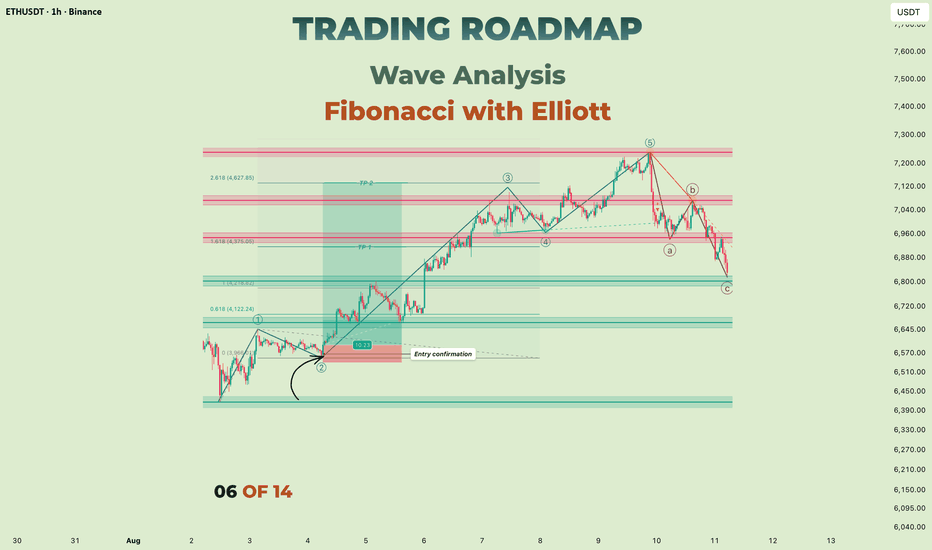
GOLD - The news could trigger a long squeezeICMARKETS:XAUUSD is consolidating within the 4355–4435 range, while the U.S. dollar remains largely stagnant ahead of the upcoming CPI data. Until the release, the market may remain trapped inside the current range while preparing for a potential liquidity manipulation
The U.S. Dollar Index is also consolidating as traders wait for the CPI report. Gold has stalled ahead of this key inflation data, and the initial reaction to CPI could be short-lived as geopolitical risks remain elevated.
A weaker-than-expected CPI could open the door to new highs, while hotter inflation data could trigger a corrective move. The market is waiting for a clear catalyst.
Bullish drivers: Weaker CPI, A weaker U.S. dollar, Lower expectations for further rate hikes, Geopolitical de-escalation
Bearish drivers: Hotter-than-expected CPI, Hawkish Fed rhetoric, A stronger U.S. dollar, Geopolitical escalation
Gold remains in a bullish phase, but news-driven volatility could create a liquidity sweep / long squeeze before the next directional move
Resistance levels: 4435, 4481
Support levels: 4356, 4313, 4302
Gold remains in a bullish phase. However, news-driven volatility could create a liquidity sweep / long squeeze before the next continuation move.
The key zones to watch are 4350 and 4313. A false breakdown of either level, followed by consolidation back above it, could become the technical catalyst for another bullish impulse.
Best regards,
R. Linda  Long
Long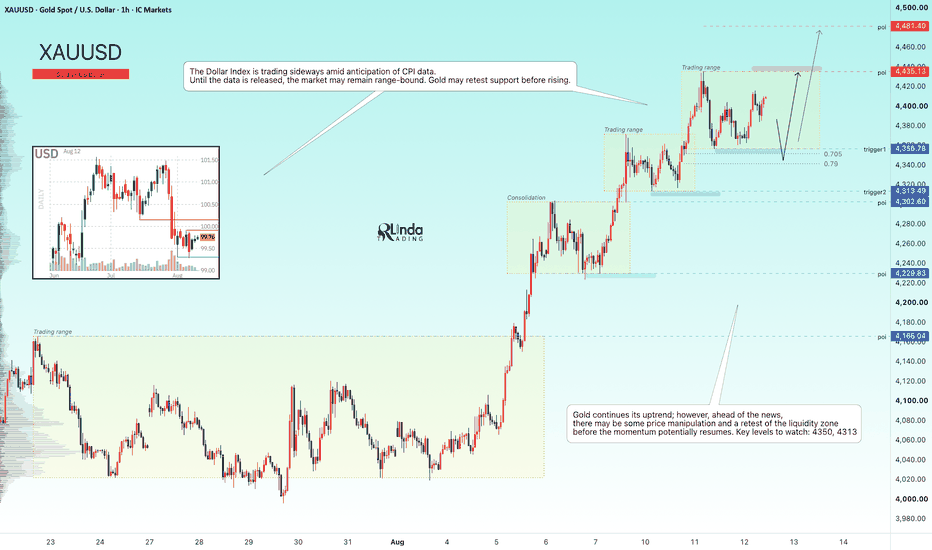
Germany DAX 40 ($DAX) Daily: Resistance Rejection at Channel Germany DAX 40 ( XETR:DAX ) Daily: Resistance Rejection at Channel Top Signals Imminent Corrective Pullback Vector
### 🇩🇪 Germany DAX 40 Index ( XETR:DAX / GER40) Daily Technical Matrix (Ref: GER40_2026-08-13_08-44-00.png)
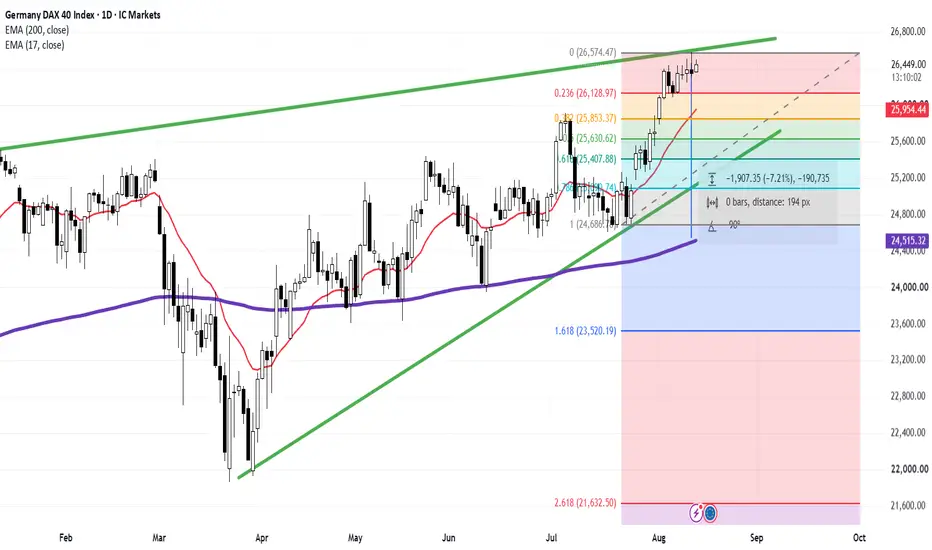
We are releasing an updated Daily (1D) technical evaluation on the Germany DAX 40 Index ( XETR:DAX / GER40). After printing a fresh record high at **26,574.47**, price action has collided directly with the upper boundary of its macro ascending channel (green trendlines), showing clear signs of buy-side exhaustion and setting up a probability-driven mean-reversion phase.
The index is currently trading at **26,444.00 (+0.35%)**, consolidating just below its newly established peak.
---
### 🔍 Technical Architecture & Corrective Vector Analysis:
Our quantitative matrix confirms that active buyers are facing structural headwinds at channel resistance, favoring a healthy corrective retracement:
1. **Upper Channel Supply Rejection (Green Upper LTA):** The expansion leg into **26,574.47 (0 Fibonacci level)** hit resistance at the upper green channel line, triggering upper wick rejection and overhead profit-taking.
2. **Mean-Reversion Gap to Dynamic EMAs:** Price action has stretched significantly away from its short-term anchor, creating a tactical gap down to the **17-period EMA (red line at 25,953.89)**.
3. **Key Fibonacci Retracement Target Corridor:** A corrective pullback off current supply is projected to test structured support nodes:
* **Immediate Resistance / High:** **26,574.47**
* **0.236 Fibonacci Support:** **26,128.97**
* **Dynamic Dynamic Support (17-EMA):** **25,953.89**
* **0.382 Fibonacci Node:** **25,853.37**
* **0.5 Fibonacci Equilibrium Base:** **25,630.62**
* **0.618 Golden Ratio Floor:** **25,407.88**
* **0.786 Fibonacci / Channel LTA Support:** **24,990.74**
---
### 🛡️ Strategic Operational Scenarios:
* **Scenario A — Corrective Retracement Phase (Primary Bias):** Profit-taking off the **26,574.47** ceiling drives a price correction back toward the **26,128.97 – 25,953.89** pocket (0.236 Fibo & 17-EMA). A deeper mean-reversion move could extend toward the **25,630.62 – 25,407.88** confluence zone to reset buyer liquidity.
* **Scenario B — Bullish Extension Above Channel:** A sustained daily close clearing **26,574.47** and breaking above the green channel resistance line invalidates the pullback projection, opening unchartered upside exploration.
### 📊 Tactical Parameters Summary:
* **Current Bias:** Neutral-Bearish Rejection / Corrective Pullback Vector
* **Primary Overhead Resistance Ceiling:** 26,574.47
* **First Support Base (0.236 Fibo / 17-EMA):** 26,128.97 – 25,953.89
* **Golden Ratio Demand Zone (0.618 Fibo):** 25,407.88
* **Macro Institutional Floor (200-EMA):** 24,515.27
---
📊 **ChartPro Data**
*European Equity Architecture, Channel Microstructure & Systematic Risk Management.*
⚠️ **Disclaimer:** For educational and informational purposes only. This active market study represents a personal trading framework and does not constitute financial or investment advice.  Short
Short
 Long
Long
 Long
Long
 Long
Long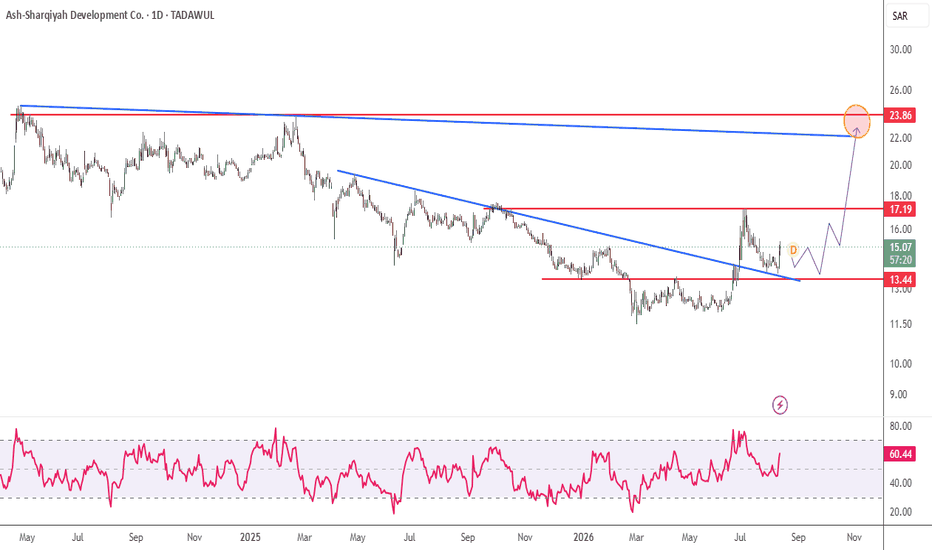
Liquidity Hunt & Market Reversal | Professional SMC BreakdownHigh Time Frame analysis is the foundation of professional trading. These charts show how price moves through market structure, liquidity zones, Break of Structure (BOS), Change of Character (CHoCH), and institutional order flow.
The first step is always identifying the overall market direction. Initially, price was following a bearish structure where sellers controlled the market and multiple BOS confirmations showed downside continuation. After creating a strong low area, the market started showing signs of weakness in sellers and strength from buyers.
The important shift happened when price created a CHoCH (Change of Character). This indicates that market behavior is changing and buyers are beginning to take control. After CHoCH, price confirmed bullish momentum by creating consecutive BOS to the upside, showing that institutions were supporting higher prices.
Key Lessons From This Chart:
1. Market Structure Comes First Never enter a trade only because of a candle pattern. First understand:
Where is the strong high?
Where is the strong low?
Is the market making Higher Highs & Higher Lows or Lower Highs & Lower Lows?
Structure tells the story of smart money.
2. Liquidity Is The Main Target Institutions often move price toward liquidity areas:
Previous Highs (PWH)
Previous Lows (PWL)
Equal Highs (EQH)
Equal Lows (EQL)
Liquidity is where many traders place stop losses. Smart money often collects this liquidity before the next major move.
3. CHoCH Is The Early Warning Signal A CHoCH does not mean instant entry. It only tells us that the previous trend may be losing power.
Professional confirmation comes after:
CHoCH appears
Price breaks structure (BOS)
Retest occurs at a valid zone
4. BOS Confirms Direction After the bullish CHoCH, every new BOS confirmed buyer dominance. This shows that demand is stronger than supply and the probability of continuation increases.
5. High Time Frame Controls Lower Time Frame The higher timeframe gives the roadmap:
Daily/4H → Market direction and important zones
1H → Setup formation
15M/5M → Entry confirmation
A trader should not fight the higher timeframe trend.
Current Market Education:
Price has shifted from a bearish environment into a bullish structure after breaking previous resistance levels. Buyers are currently defending higher lows, showing strength.
The main areas to watch:
Resistance / Liquidity Zone: Previous highs and weak highs can become liquidity targets where price may search for orders.
Support / Demand Zone: Previous BOS areas and strong lows can act as institutional buying zones.
If buyers continue holding above important structure, continuation toward higher liquidity is possible. However, if price loses the last protected low, the bullish structure can weaken and a deeper retracement may occur.
Professional Trading Rules From This Analysis:
✓ Follow structure, not emotions
✓ Wait for liquidity sweep before entry
✓ Use CHoCH for reversal confirmation
✓ Use BOS for trend continuation
✓ Enter from strong zones, not random candles
✓ Always protect capital with risk management
✓ Discipline is more important than prediction
The biggest lesson: "Professional traders do not predict every move. They wait for the market to reveal its intention through structure, liquidity, and confirmation
Market Structure Shift + Liquidity Expansion
This chart represents a professional Smart Money Concept (SMC) approach where price action is analyzed through structure, liquidity, and institutional order flow.
The market first created a consolidation phase where buyers and sellers were collecting liquidity. During this phase, equal highs and equal lows formed, creating liquidity pools that institutions often target before the next major move.
After the formation of a CHoCH (Change of Character), buyers started gaining control. Price broke previous resistance levels and printed multiple BOS (Break of Structure) confirmations, showing a clear shift from accumulation into bullish expansion.
The strong bullish impulse shows that demand is dominating the market. After the breakout, price entered a retracement phase to rebalance the move while maintaining the bullish structure.
Key Learning Points:
• Accumulation Before Expansion:
Smart money often builds positions during sideways movement before a strong directional move.
• CHoCH Gives Early Confirmation:
A change in market behavior is the first sign that the previous trend may be ending.
• BOS Confirms Continuation:
Every successful break of structure increases the probability of trend continuation.
• Liquidity Is The Target:
Price is attracted toward weak highs, previous highs, and liquidity zones where institutional orders are available.
• Strong Low Protection:
As long as the protected low remains intact, buyers maintain control.
Trading Lesson:
Do not chase large candles after a breakout. Professional traders wait for:
Liquidity sweep
Structure confirmation
Retest of demand/order block
Risk-managed entry
The market does not move randomly; every expansion phase is built after liquidity collection and structural confirmation.
SMC Rule:
First understand where liquidity is resting, then follow where smart money is moving
This chart represents a complete SMC bullish reversal model, where price transitions from a bearish environment into a strong institutional expansion phase.
The market was initially moving inside a range with repeated BOS and CHoCH formations, showing the battle between buyers and sellers. After creating a Strong Low, price started showing accumulation signs and buyers began absorbing selling pressure.
The major turning point came when price broke above the previous bearish structure with a clear CHoCH (Change of Character). This confirmed that market sentiment was shifting from seller control to buyer dominance.
After the CHoCH confirmation, price created multiple BOS (Break of Structure) signals, proving strong bullish order flow. Each breakout created a new higher high and protected higher low, showing institutional buying strength.
Key Educational Points:
1. Trend Reversal Process A professional reversal is not identified by one candle. It develops through:
Liquidity collection
CHoCH confirmation
BOS continuation
Retest and expansion
2. Liquidity & Stop Hunt Concept Before the bullish move, price collected liquidity around previous lows and weak positions. Institutions use these areas to build positions before driving price higher.
3. Strong Low Protection The strong low acts as the foundation of the bullish structure. As long as price respects this area, buyers remain in control.
4. Weak High Liquidity Target The current price is approaching weak highs, where liquidity is resting. Markets often target these areas before deciding the next move.
5. Multi-Timeframe Approach High timeframe defines the direction:
Identify structure shift on HTF
Mark liquidity zones
Wait for lower timeframe confirmation
Execute with proper risk management
Professional Trading Lesson:
Do not buy because price is already moving.
Wait for the market to show: Liquidity → Structure Shift → Confirmation → Entry
SMC Principle:
Smart money does not chase price; it creates the move after collecting liquidity
This chart explains the complete journey of price from bearish distribution to bullish reversal, using Smart Money Concepts (SMC) principles.
The market started with a clear bearish structure, where sellers maintained control by creating consecutive Lower Highs and Lower Lows. Multiple BOS (Break of Structure) confirmations showed continuous downside pressure.
After reaching the lower liquidity area, price formed a Weak Low zone, where selling momentum started decreasing. This area became important because institutions often accumulate positions near liquidity zones before a major reversal.
The major turning point appeared when price created a CHoCH (Change of Character). This was the first indication that market control was shifting from sellers to buyers.
Following the CHoCH, price developed a bullish structure by:
Breaking previous resistance levels
Creating Higher Highs
Protecting Higher Lows
Printing bullish BOS confirmations
This transition represents the shift from seller dominance → institutional accumulation → buyer expansion.
Key Educational Lessons:
1. Identify The Market Phase Every market moves through phases:
Distribution
Expansion
Accumulation
Reversal
Understanding the phase prevents traders from entering against the dominant flow.
2. CHoCH Is The First Signal, Not The Entry A CHoCH only shows that the old trend is weakening. Professional traders wait for:
Liquidity confirmation
BOS confirmation
Retest of demand areas
3. Liquidity Controls Price Movement The market often targets:
Previous Highs (PWH)
Previous Lows (PWL)
Strong Highs
Weak Lows
These areas contain trapped orders and liquidity.
4. Higher Time Frame Gives The Direction The bigger timeframe shows the institutional intention. Lower timeframes should only be used for precise entries after the higher timeframe bias is clear.
Professional Trading Mindset:
Do not focus on predicting every candle.
Focus on understanding where liquidity is located, who controls the structure, and when the market changes character.
SMC Principle:
The trend changes when smart money changes position. First comes liquidity, then structure, then expansion
Education 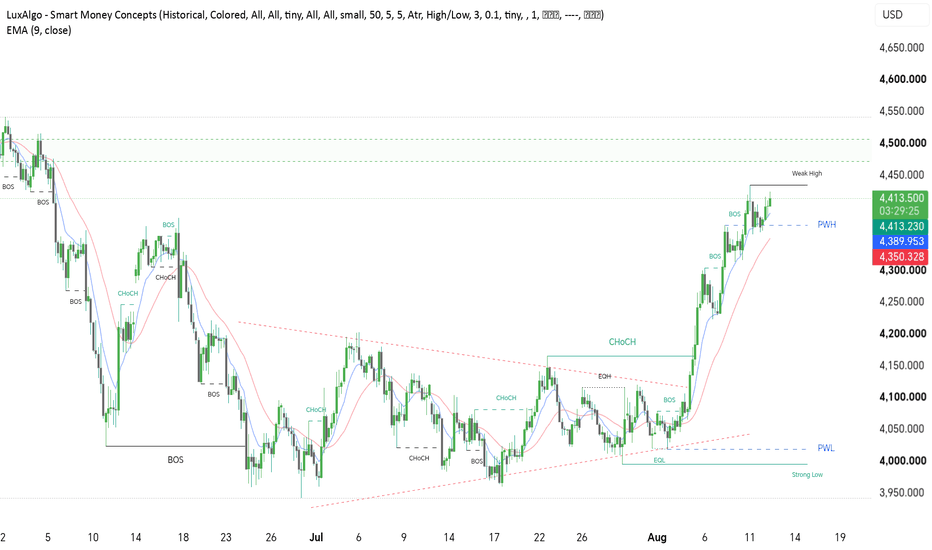
 Long
Long
Gold at $4,355: Breakout or Pullback?
Gold remains structurally bullish on H1, but price is now trading directly beneath a major external high at 4,370.607.
That makes the current area interesting — but not necessarily attractive for chasing longs.
📊 H1 Structure
The bullish structure remains intact:
Higher highs + higher lows
Price holding above the rising support trendline
Previous bullish displacement remains valid
Price is approaching external buy-side liquidity
Current location = premium
The key level is 4,370.607.
A clean H1 close above this level would confirm that buyers are still in control and could trigger a liquidity expansion toward 4,400–4,410.
But there is another possibility.
⚠️ The Pullback Scenario
If Gold sweeps or rejects 4,370.607, the first area I would watch is:
Decision Zone: 4,300–4,310
This is the critical H1 reaction area.
If buyers defend it → bullish continuation remains the preferred scenario.
If price loses it → the market could rebalance toward:
Internal Support: 4,225–4,240
And if the correction becomes deeper:
Discount Zone: 4,185–4,200
This would actually create a much cleaner location for looking for bullish confirmation.
📰 Macro Catalyst
The latest US labor report showed -23K payroll growth in July, with unemployment at 4.1%. Wage growth was 3.2% YoY. The softer labor backdrop has helped keep the Gold bid alive.
But the next major test comes quickly:
CPI — Aug 12
PPI — Aug 13
Both releases can significantly change USD/yield expectations and therefore Gold volatility.
🎯 Trading Map
Bullish Scenario
H1 closes above 4,370.607
→ BSL taken
→ Momentum expansion
→ 4,400–4,410
Pullback Scenario
Rejection from 4,370.607
→ retracement into 4,300–4,310
→ bullish reaction
→ continuation toward 4,370 → 4,400
Bearish Shift
H1 loses 4,300–4,310
→ 4,225–4,240
→ deeper discount 4,185–4,200
What do you think — 4,370 breakout first, or 4,200 retracement first? Short 
Gold M30: Is 4,435 the Local Top?Gold is trading near 4,420 after a strong impulsive rally that pushed price into a fresh external high at 4,435.080.
At this location, chasing longs becomes increasingly unattractive.
The bigger question is:
Did Gold just complete a liquidity run — or is another expansion higher coming?
📊 M30 Structure
The bullish move remains strong, but price is now entering a premium area after breaking out of the previous consolidation.
Key observations:
External high: 4,435.080
Current price: ~4,420
Previous consolidation breakout remains intact
Price is now trading above the ascending trendline
Momentum is extended after the impulsive expansion
A Fibonacci retracement zone sits around 4,380–4,395
Trendline retest zone: 4,345–4,352
Major downside liquidity/support: 4,300
This creates an interesting buy-side liquidity → retracement setup.
🎯 Bearish Scenario
If price fails to sustain above 4,435, I would watch for a pullback rather than immediately chasing shorts.
Scenario 1 — Premium rejection
4,435 liquidity sweep
↓
4,380–4,395 Fibonacci retracement
↓
4,345–4,352 trendline retest
↓
4,300 major support
The key confirmation would be a M30 bearish displacement + structure shift after rejection.
🟢 Bullish Invalidation
The bearish idea becomes weaker if Gold produces a clean M30 breakout and acceptance above:
4,435.080
If that happens, the market may be entering another buy-side expansion rather than a corrective phase.
So the level I care about most is not 4,420.
It's 4,435.
📰 Macro Catalyst
The next major volatility trigger is US inflation.
CPI: August 12
PPI: August 13
A hotter inflation print could support yields/USD and pressure Gold, while softer inflation could reinforce the bullish Gold narrative. The BLS has scheduled July CPI for August 12 and July PPI for August 13, both at 8:30 a.m. ET.
🔥 My Bias
Short-term: Bearish correction risk
Medium-term: Still bullish while 4,300 holds
Decision level: 4,435
Pullback zone: 4,380–4,395
Trendline retest: 4,345–4,352
Major support: 4,300
The interesting trade may not be buying the breakout.
It may be waiting for the liquidity sweep first.
Would you buy above 4,435 — or wait for the pullback? Short 
 Short
Short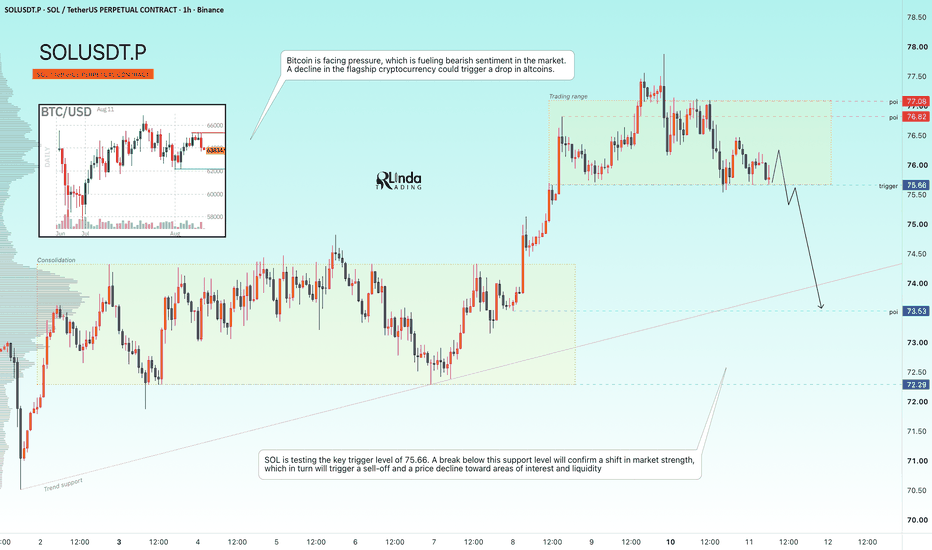
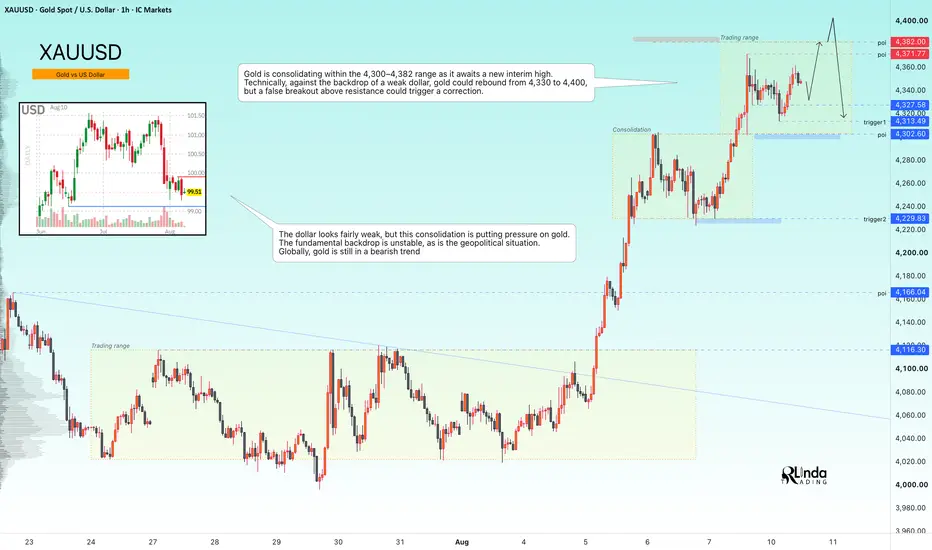
GOLD - Retest of 4400. Waiting for a false breakout ICMARKETS:XAUUSD is showing local bullish momentum, but price is approaching a major resistance zone at 4382–4400. At the same time, the U.S. dollar remains weak, although its current consolidation continues to create pressure across the markets
The fundamental backdrop remains unstable. Geopolitical risks continue to support the dollar, while expectations for further Fed rate hikes have weakened. Against this mixed backdrop, gold remains within a broader bearish trend.
Gold is consolidating inside the 4300–4382 range while preparing for a potential retest of the recent high. Technically, continued dollar weakness could allow gold to rebound from 4330 toward 4400. However, profit-taking around 4380–4400, followed by a false breakout, could trigger a reversal.
Bullish drivers: Weaker-than-expected inflation data, Continued U.S. dollar weakness, Lower rate expectations
Bearish drivers: U.S. dollar strengthening, Rising oil prices and inflation expectations, Profit-taking ahead of the CPI report
Resistance levels: 4371, 4382, 4400
Support levels: 4327, 4313, 4302
A short squeeze through the resistance zone followed by a bearish reversal pattern could trigger a pullback or even reverse the current local bullish momentum.
However, an unexpected fundamental catalyst or a sustained close above 4400 could invalidate the bearish setup and open the way toward 4450–4475.
Best regards,
R. Linda Short 
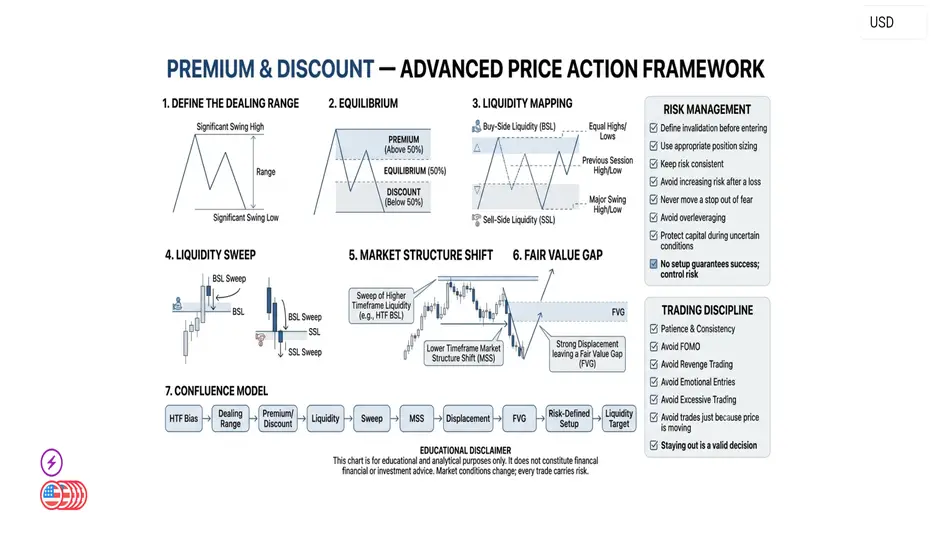
Premium & Discount: Advanced Market StructurePremium and Discount are used to evaluate where price is trading within a defined dealing range. This framework becomes more effective when combined with higher-timeframe structure, liquidity, displacement, Market Structure Shift (MSS), and Fair Value Gaps (FVG).
1. Define the Dealing Range
Start by identifying a clear and meaningful swing high and swing low. The range provides the framework for determining where price is trading relative to its equilibrium.
2. Equilibrium
The 50% level divides the dealing range into two sections:
• Above 50% = Premium
• Below 50% = Discount
• 50% = Equilibrium
The location of price alone should not be treated as an entry signal. Context and confirmation remain essential.
3. Liquidity Mapping
Identify important liquidity pools such as:
• Buy-Side Liquidity (BSL)
• Sell-Side Liquidity (SSL)
• Equal Highs
• Equal Lows
• Previous Session Highs/Lows
• Major Swing Highs/Lows
Understanding where liquidity may be located helps provide context for potential price reactions.
4. Liquidity Sweep
A liquidity sweep occurs when price temporarily trades through an obvious liquidity area before showing a potential shift in order flow.
A sweep by itself is not confirmation of a reversal. Additional structure and price-action confirmation should be considered.
5. Market Structure Shift
After a liquidity event, monitor the lower-timeframe structure for a potential MSS. A meaningful displacement through structure can provide stronger confirmation than a simple wick or temporary breakout.
6. Fair Value Gap
Strong displacement can leave an imbalance or Fair Value Gap. Traders may study these areas as potential reaction zones, but an FVG should not automatically be treated as a guaranteed entry.
7. Confluence Model
A stronger educational framework can be built around:
HTF Bias → Dealing Range → Premium/Discount → Liquidity → Sweep → MSS → Displacement → FVG → Risk-Defined Setup → Liquidity Target
The more independent pieces of confirmation align, the more structured the setup becomes.
Risk Management
Risk management remains more important than finding the perfect entry.
• Define invalidation before entering
• Use appropriate position sizing
• Keep risk consistent from trade to trade
• Avoid increasing risk after a losing trade
• Never move a stop simply because you do not want to accept a loss
• Avoid overleveraging
• Protect capital during uncertain market conditions
No setup has a guaranteed outcome. A high-quality setup can still fail, which is why risk must always be controlled.
Trading Discipline
Professional execution requires patience and consistency.
Avoid FOMO, revenge trading, emotional entries, excessive screen-time trading, and taking trades simply because price is moving. If the required conditions are not present, staying out is also a valid decision.
The objective is not to trade every move. The objective is to wait for a clear framework, execute according to the plan, and manage risk consistently.
Educational Disclaimer
This chart is created for educational and analytical purposes only. It does not constitute financial or investment advice. Market conditions can change rapidly, and every trading setup carries risk. Education 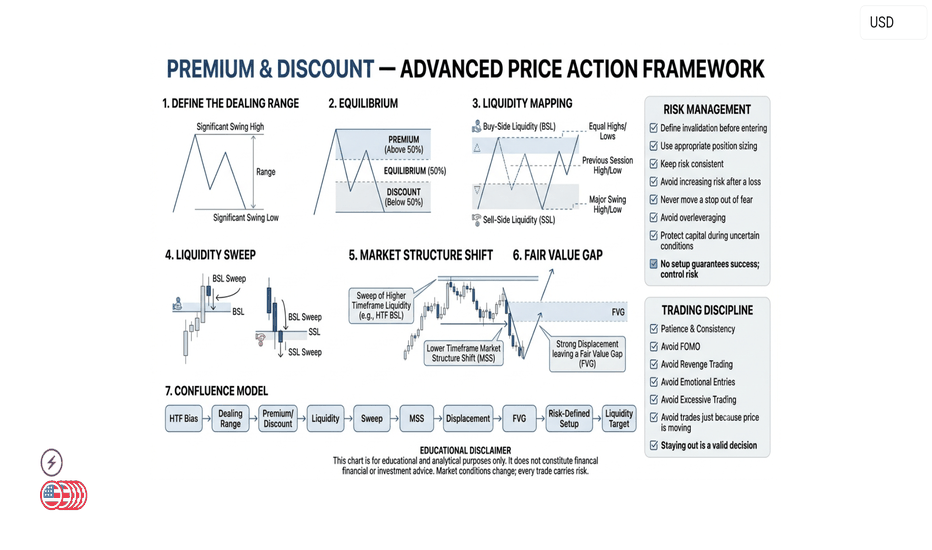
Al Munajem Foods : Slow & SteadyTADAWUL:4162
📈 Slow & Steady Climb Toward a Weekly Breakout — Is the Next Major Rally Approaching? 🇸🇦
The weekly chart continues to paint a constructive bullish picture, with price steadily advancing toward a major breakout zone. Unlike explosive rallies, this gradual ascent reflects healthy accumulation, often laying the groundwork for a stronger and more sustainable uptrend.
The key now is confirmation above resistance.
🔍 Technical Outlook
The 67 price level is the most important resistance on the chart.
A weekly close above 67, followed by sustained trading above this level, would confirm a breakout and significantly improve the probability of a fresh bullish expansion.
This breakout could mark the transition from accumulation to trend continuation.
⚠️ Buy-the-Dip Opportunity
If the breakout is delayed and the stock undergoes a healthy correction, the 55 support zone becomes the area to watch.
Historically, this level has acted as a strong reversal and demand zone, attracting buyers during previous pullbacks.
A successful retest of 55 would keep the long-term bullish structure intact while offering a more attractive risk-to-reward entry.
🎯 Profit-Taking Zones
Once the stock confirms a breakout above 67, the first upside objectives are:
🎯 Target 1: 76
🎯 Target 2: 90
These levels represent the next major resistance zones where traders may consider partial profit-taking.
🚀 Extended Bullish Targets
If momentum remains strong and the weekly trend continues to print Higher Highs and Higher Lows, the next Fibonacci and structural targets come into focus:
🚀 118
🚀 135
🚀 150
🚀 163
These extended targets become increasingly probable only if price maintains its bullish market structure and breakout momentum.
📊 My View
The stock is quietly building strength, and sometimes those are the setups that deliver the biggest moves.
✅ Slow and steady weekly accumulation.
✅ 67 remains the key breakout confirmation level.
✅ 55 is the ideal demand zone if a healthy pullback develops.
✅ Initial targets: 76 → 90.
✅ Long-term bullish roadmap: 118 → 135 → 150 → 163.
Patience pays. Waiting for a confirmed breakout above 67 or a disciplined buy near 55 could offer the best risk-to-reward opportunity.
Do you expect the stock to break above 67 on the first attempt, or will it revisit 55 before launching its next major rally? Share your technical view below! 👇
⚠️ Financial Disclaimer
Disclaimer: This analysis is provided for educational and informational purposes only and should not be considered financial, investment, or trading advice. Always conduct your own research (DYOR) and apply disciplined risk management before making any investment decisions.
#Tadawul #SaudiStockMarket #SaudiStocks #TASI #SaudiInvesting #SaudiTrading #SaudiInvestors #KSAStocks #SaudiEquities #RiyadhMarket #GCCMarkets #MiddleEastMarkets
#TechnicalAnalysis #TradingView #PriceAction #WeeklyChart #Breakout #TrendFollowing #MarketStructure #HigherHigh #HigherLow #SupportAndResistance #SwingTrading #MomentumTrading #BreakoutTrading #ChartAnalysis #StockAnalysis #TradingIdeas #LongTermInvesting #BullishSetup #RiskManagement #Fibonacci
#WiSHFundManagement  Long
Long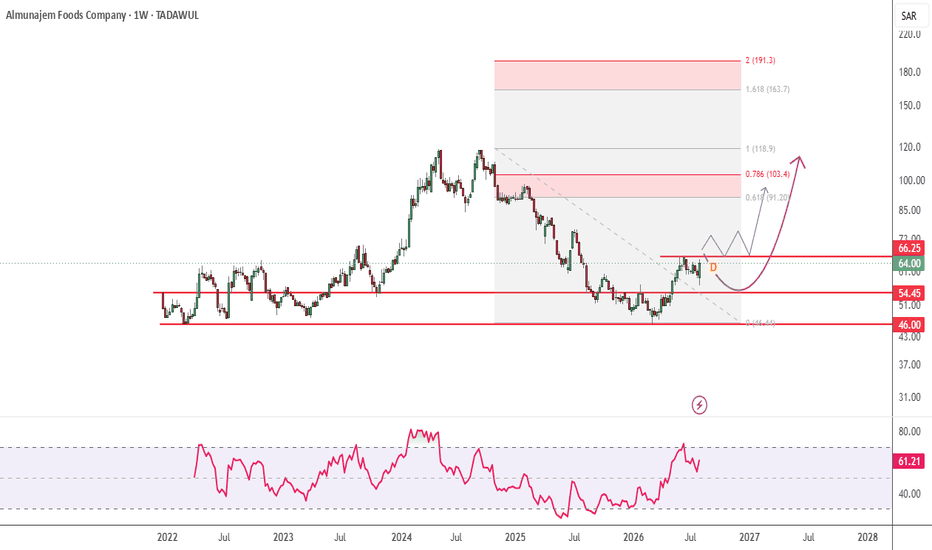
GOLD - Local bullish sentiment. NFP coming upFollowing a strong rally, ICMARKETS:XAUUSD has entered a consolidation phase, signaling the potential for further upside if buyers can successfully defend the 4300 level.
The U.S. Dollar Index has broken its bullish structure, although the broader fundamental backdrop remains mixed. Geopolitical uncertainty persists, while the Federal Reserve continues to maintain a hawkish stance.
After the recent advance, gold is consolidating and building a liquidity pool around the 4242–4229 zone, which market makers may test before another move higher. There is also a possibility that this could become gold's strongest weekly performance since January.
The next major catalyst will be the U.S. Non-Farm Payrolls (NFP) report. A weaker-than-expected labor market reading could fuel another rally, while stronger data may restore downside pressure. Market participants will also continue to monitor developments in the Middle East and U.S.–Iran negotiations.
Bullish drivers: Weaker-than-expected NFP, A weaker U.S. dollar, Lower interest rate expectations, Progress in geopolitical negotiations
Bearish drivers: Strong NFP data, Hawkish Federal Reserve rhetoric, A stronger U.S. dollar, Escalation of geopolitical tensions
Resistance levels: 4300, 4330, 4370
Support levels: 4242, 4229, 4200
From a technical perspective (setting aside the unpredictability of news events), gold still has room to extend its rally.
Two primary scenarios:
A long squeeze into the 4242–4229 support zone could restore bullish momentum.
A breakout and sustained close above 4300 could also become the technical catalyst for another leg higher.
Best regards,
R. Linda Long 
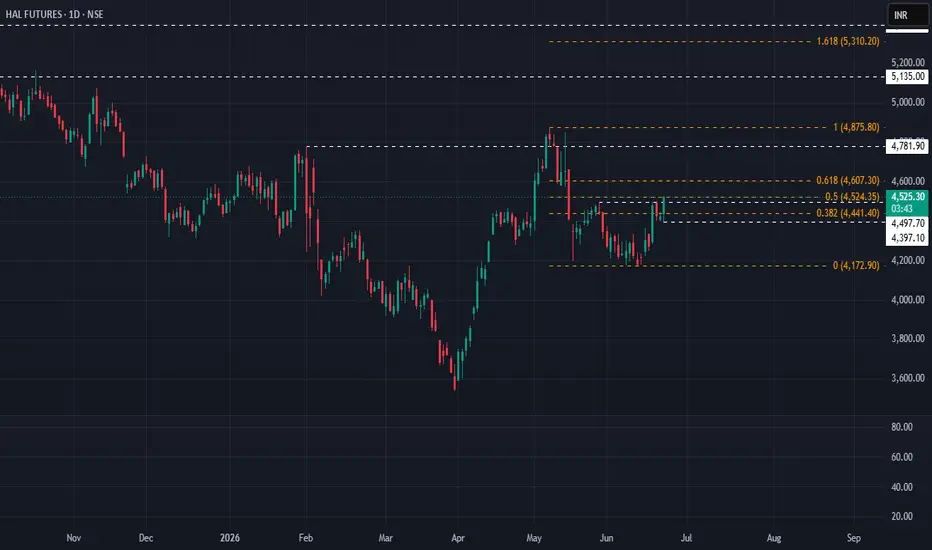
HAL Breakout from Rounding Bottom Pattern | Potential Trend ReveHAL (Hindustan Aeronautics Ltd.) – Technical View
CMP: ₹4,520
Stop Loss: ₹4,390
Targets: ₹4,608 | ₹4,875
HAL is showing signs of a potential trend reversal after forming a rounding bottom pattern and successfully breaking above the neckline resistance. The breakout indicates improving buying interest and a possible shift in momentum toward the upside.
A sustained move above the breakout zone may lead to an advance toward ₹4,608 in the near term, while a stronger follow-through could extend the rally toward ₹4,875.
Risk Management:
Maintain strict stop-loss discipline.
Control position sizing.
Avoid overexposure in a volatile market.
Pyramiding can be considered only after a sustained move above key resistance levels and confirmation of trend continuation.
Consider partial profit booking near Target 1 and trail stop loss thereafter.
⚠️ Be cautious in volatile markets. Maintain strict stop-loss discipline, control position sizing, avoid aggressive pyramiding, and do not overexpose capital.
⚠️ Clarification:
This is an independent analysis based purely on technical and market study. No part of Religare is involved in this view or recommendation.
📝 Important:
I am not responsible for any loss or profit incurred. I am not taking any fees for these views—just sharing my analysis for educational and informational purposes.
📉 Disclaimer:
Not SEBI-registered. Please do your own research or consult a financial advisor before taking any investment decision.  Long
Long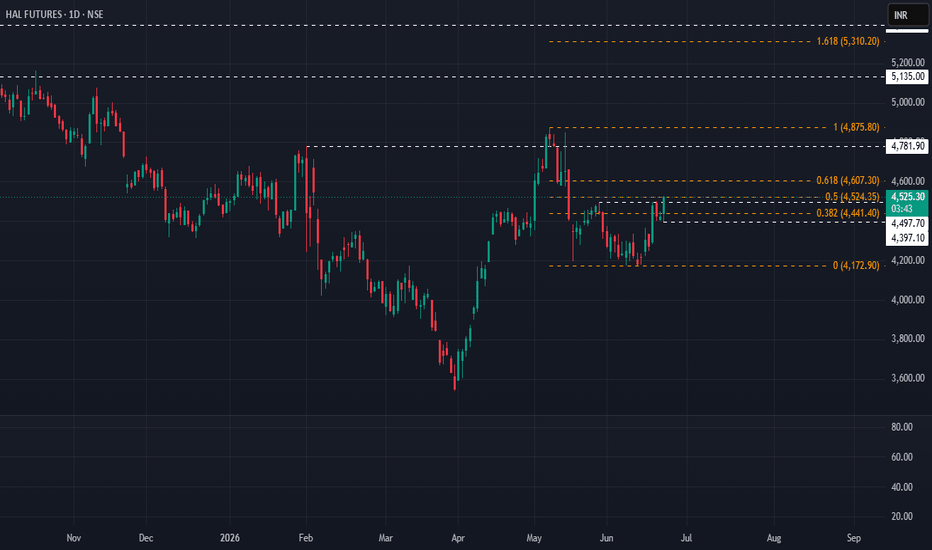
Long