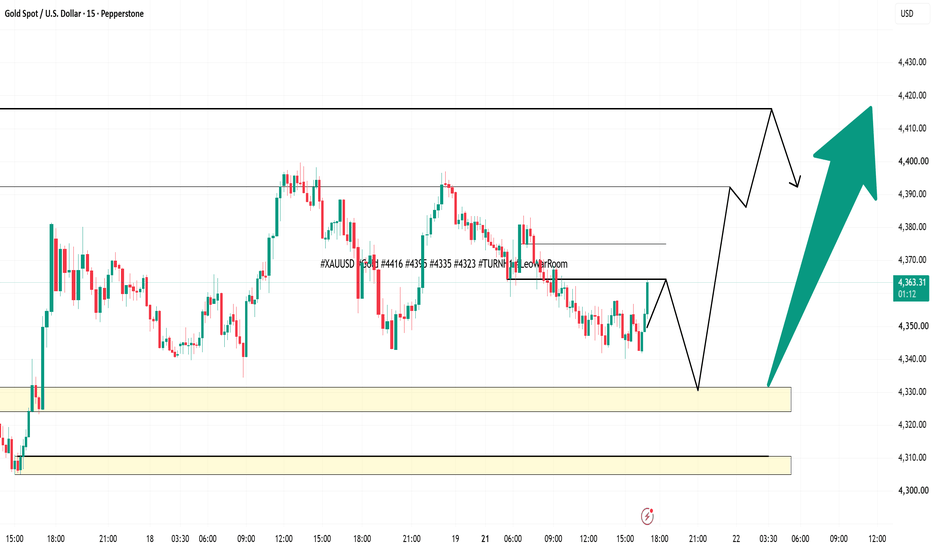
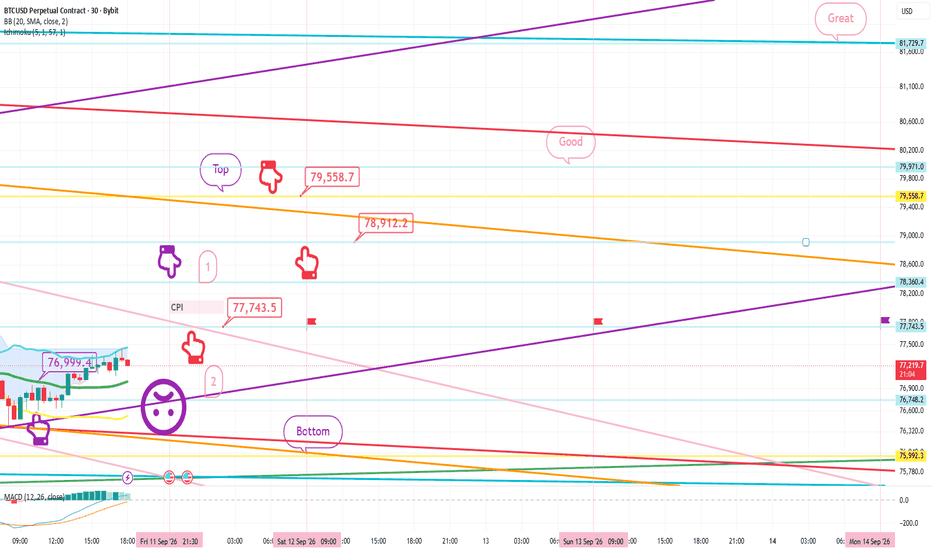
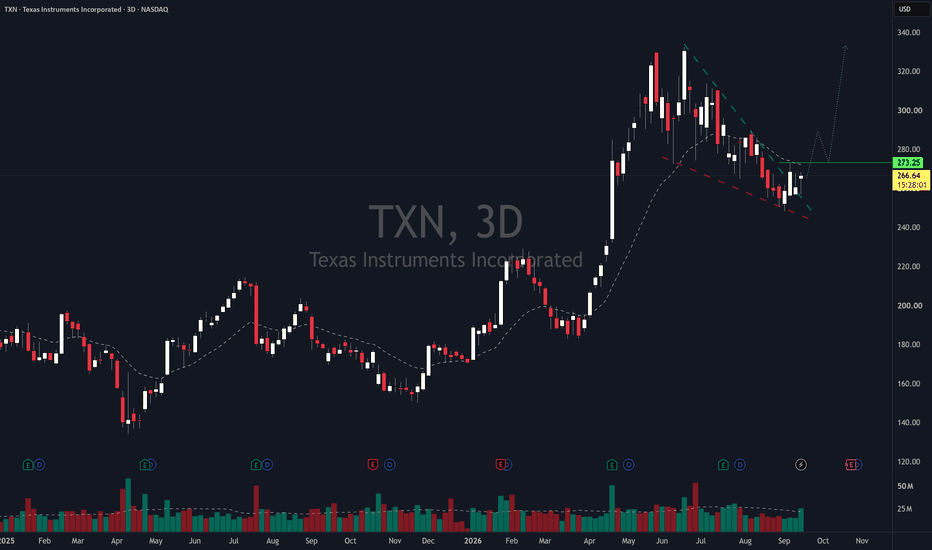
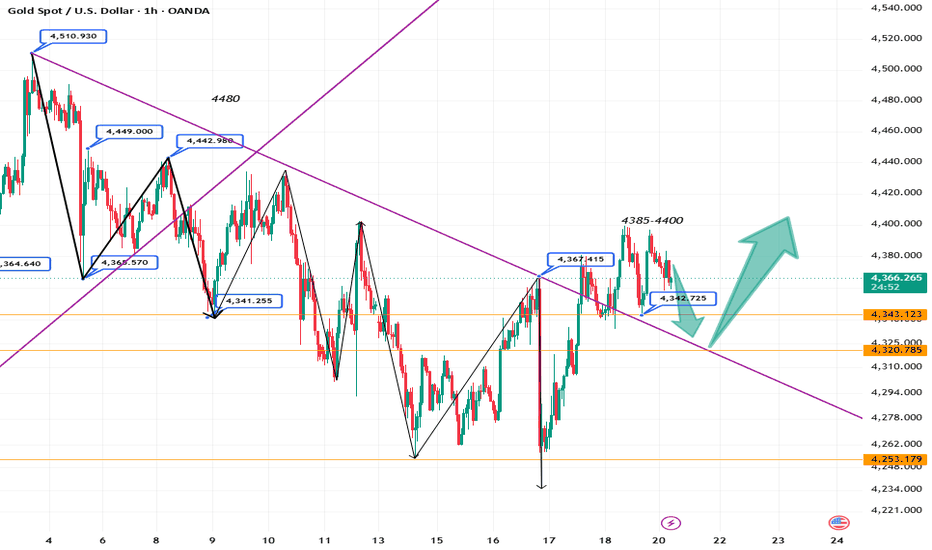
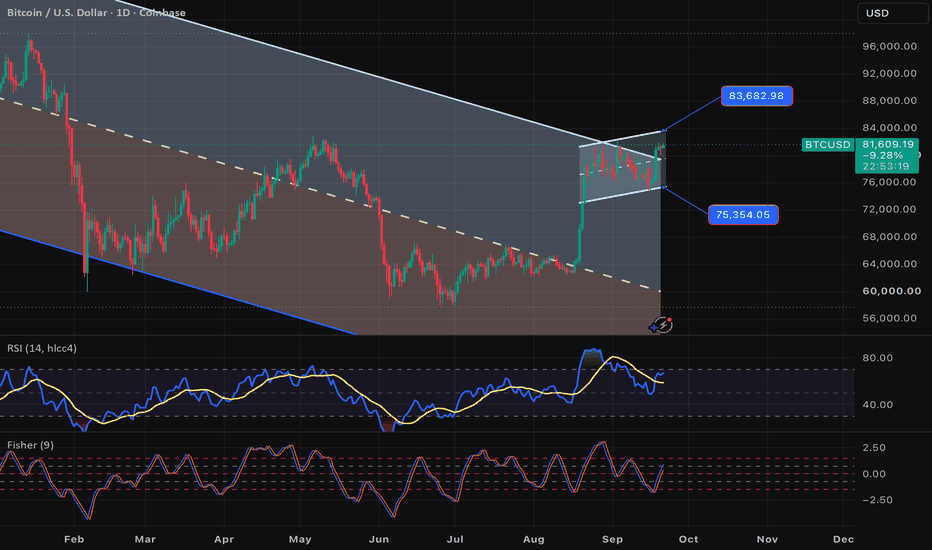
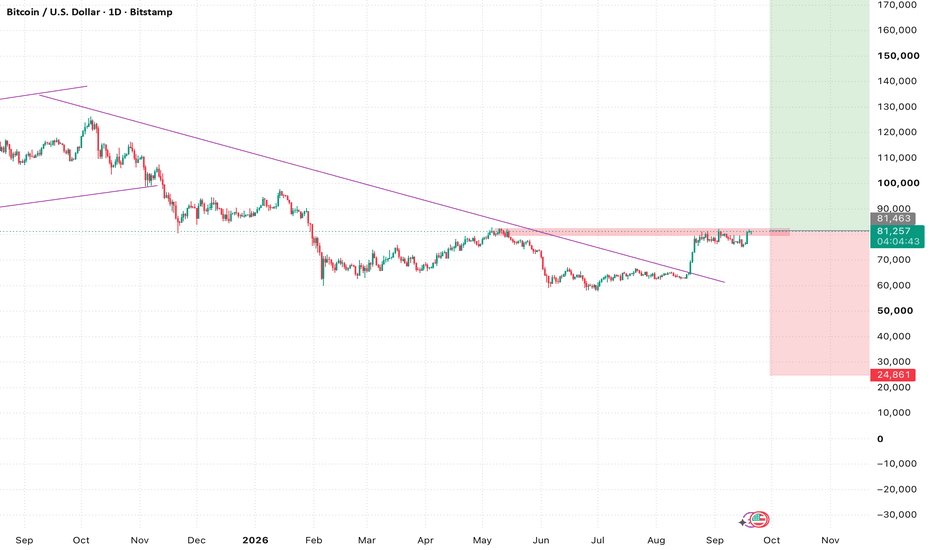
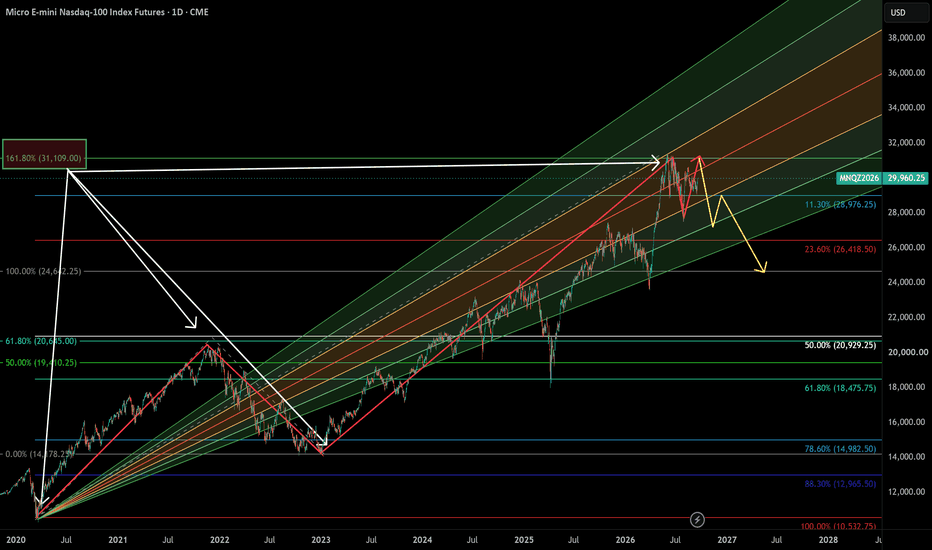
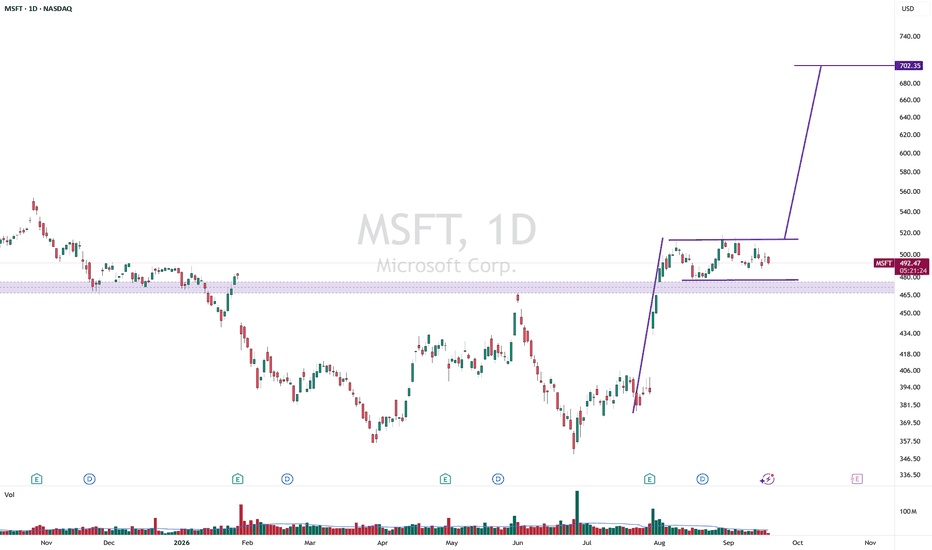
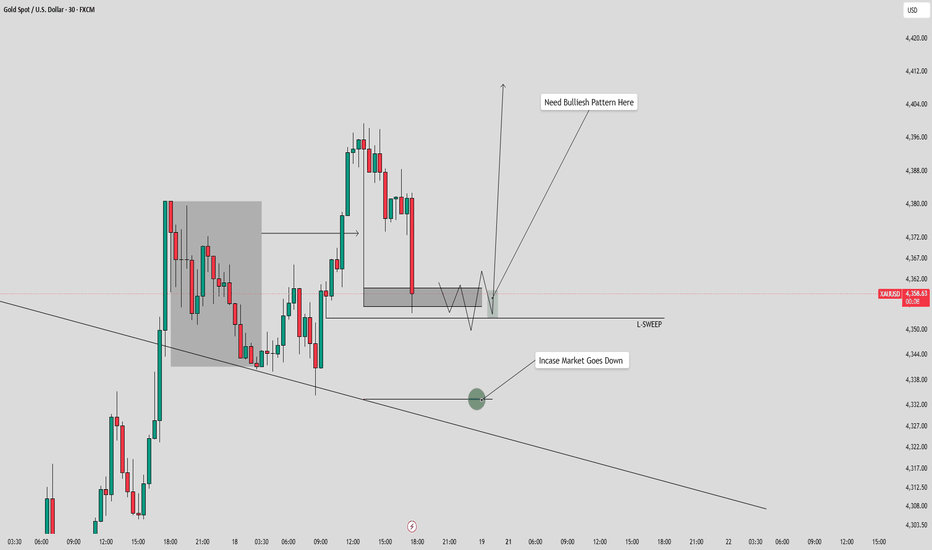
Daily Outlook || 13th July || CPI EveMarkets are sitting on a knife's edge heading into tomorrow's CPI print. Liquidity has been building on both sides of the market across forex, indices, gold, and Bitcoin โ a setup that typically precedes a sharp directional resolution. Today's session is about mapping where that liquidity sits, not predicting which way it breaks.
In this video, we break down EURUSD, GBPUSD, XAUUSD (Gold), S&P 500, Nasdaq 100, and Bitcoin through the lens of:
Market Structure
Liquidity Mapping
Institutional Order Flow
ICT Concepts & Smart Money Concepts
Premium & Discount Zones
Fair Value Gaps
Order Blocks
Daily Bias Framework
With CPI on the calendar, this is a two-sided market โ and knowing where the resting liquidity is matters more than guessing the headline number.
Why you should watch:
โ Key liquidity pools above and below current price
โ Areas where institutions are likely to react
โ Risk management going into a high-impact news event
โ Bullish and bearish scenarios mapped for both outcomes
โ Confirmation levels to validate direction post-CPI
This analysis is for educational purposes only and does not constitute financial advice. Always manage risk and trade your own plan.
CPI tomorrow means big moves are coming โ but which side gets swept first? Drop your bias below: are you leaning long or short into the print? Let's compare notes before the data hits.
Gann
| AUDUSD | POTENTIAL LONG WITH DXY CONFLUENCE |๐| Q3 | W29 | D13 | Y26 |
๐| AUDUSD | POTENTIAL LONG WITH DXY CONFLUENCE |
๐ก| FRGNT DAILY CHART ANALYSIS |
This forecast is built using an advanced adaptation of Smart Money Concepts, with a structured and disciplined approach:
โข Marking Key Points of Interest (POIs) on Higher Time Frames (HTFs) ๐ฐ๏ธ
โข Defining a clear, controlled trading range from those zones ๐
โข Refining entries on Lower Time Frames (LTFs) ๐
โข Waiting for confirmed Break of Structure (BoS) before execution โ
This process ensures precision, removes emotional decision-making, and keeps me aligned with the overall market narrative.
๐ก Core Philosophy
โCapital management, discipline, and consistency create longevity.โ
A strong risk-to-reward model, paired with high-probability execution, is the foundation of sustainable trading ๐๐
โ ๏ธ Understanding Losses
"Losses are part of the game" โ a mathematical certainty ๐ฒ
They donโt define performance. Nor do they define you as a Trader.
They are managed, reviewed, and used as evidence for growth ๐
๐ Final Note
Appreciate you taking the time to review todayโs forecast.
Stay disciplined ๐ฏ
Protect your capital ๐
โ FRGNT ๐๐
๐ Disclaimer
This content is provided for educational purposes only and does not constitute financial advice.
It reflects my personal approach to the markets โ a tested framework that has supported my own journey toward consistent profitability in currency trading.
Please understand that any forecasts shared are not financial advice. I will be looking for confirmation in line with my setup model and specific entry criteria from the key areas identified on the chart.
All analysis, whether presented via image or video, is shared strictly for educational insight and is not intended to breach any TradingView House Rules.
FX:AUDUSD
| EURUSD | 4H & DAILY RANGE | Q3 | W29 | D13 | Y26 |๐| Q3 | W29 | D13 | Y26 |
๐| EURUSD | 4H & DAILY RANGE |
๐ก| FRGNT DAILY CHART ANALYSIS |
This forecast is built using an advanced adaptation of Smart Money Concepts, with a structured and disciplined approach:
โข Marking Key Points of Interest (POIs) on Higher Time Frames (HTFs) ๐ฐ๏ธ
โข Defining a clear, controlled trading range from those zones ๐
โข Refining entries on Lower Time Frames (LTFs) ๐
โข Waiting for confirmed Break of Structure (BoS) before execution โ
This process ensures precision, removes emotional decision-making, and keeps me aligned with the overall market narrative.
๐ก Core Philosophy
โCapital management, discipline, and consistency create longevity.โ
A strong risk-to-reward model, paired with high-probability execution, is the foundation of sustainable trading ๐๐
โ ๏ธ Understanding Losses
"Losses are part of the game" โ a mathematical certainty ๐ฒ
They donโt define performance. Nor do they define you as a Trader.
They are managed, reviewed, and used as evidence for growth ๐
๐ Final Note
Appreciate you taking the time to review todayโs forecast.
Stay disciplined ๐ฏ
Protect your capital ๐
โ FRGNT ๐๐
๐ Disclaimer
This content is provided for educational purposes only and does not constitute financial advice.
It reflects my personal approach to the markets โ a tested framework that has supported my own journey toward consistent profitability in currency trading.
Please understand that any forecasts shared are not financial advice. I will be looking for confirmation in line with my setup model and specific entry criteria from the key areas identified on the chart.
All analysis, whether presented via image or video, is shared strictly for educational insight and is not intended to breach any TradingView House Rules.
FX:EURUSD
| USDCAD| POTENTIAL SHORT WITH DXY CONFLUENCE |๐| Q3 | W29 | D13 | Y26 |
๐| USDCAD| POTENTIAL SHORT WITH DXY CONFLUENCE |
๐ก| FRGNT DAILY CHART ANALYSIS |
This forecast is built using an advanced adaptation of Smart Money Concepts, with a structured and disciplined approach:
โข Marking Key Points of Interest (POIs) on Higher Time Frames (HTFs) ๐ฐ๏ธ
โข Defining a clear, controlled trading range from those zones ๐
โข Refining entries on Lower Time Frames (LTFs) ๐
โข Waiting for confirmed Break of Structure (BoS) before execution โ
This process ensures precision, removes emotional decision-making, and keeps me aligned with the overall market narrative.
๐ก Core Philosophy
โCapital management, discipline, and consistency create longevity.โ
A strong risk-to-reward model, paired with high-probability execution, is the foundation of sustainable trading ๐๐
โ ๏ธ Understanding Losses
"Losses are part of the game" โ a mathematical certainty ๐ฒ
They donโt define performance. Nor do they define you as a Trader.
They are managed, reviewed, and used as evidence for growth ๐
๐ Final Note
Appreciate you taking the time to review todayโs forecast.
Stay disciplined ๐ฏ
Protect your capital ๐
โ FRGNT ๐๐
๐ Disclaimer
This content is provided for educational purposes only and does not constitute financial advice.
It reflects my personal approach to the markets โ a tested framework that has supported my own journey toward consistent profitability in currency trading.
Please understand that any forecasts shared are not financial advice. I will be looking for confirmation in line with my setup model and specific entry criteria from the key areas identified on the chart.
All analysis, whether presented via image or video, is shared strictly for educational insight and is not intended to breach any TradingView House Rules.
| USDJPY | POTENTIAL SHORT WITH DXY CONFLUENCE | ๐| Q3 | W29 | D13 | Y26 |
๐| USDJPY | POTENTIAL SHORT WITH DXY CONFLUENCE |
๐ก| FRGNT DAILY CHART ANALYSIS |
This forecast is built using an advanced adaptation of Smart Money Concepts, with a structured and disciplined approach:
โข Marking Key Points of Interest (POIs) on Higher Time Frames (HTFs) ๐ฐ๏ธ
โข Defining a clear, controlled trading range from those zones ๐
โข Refining entries on Lower Time Frames (LTFs) ๐
โข Waiting for confirmed Break of Structure (BoS) before execution โ
This process ensures precision, removes emotional decision-making, and keeps me aligned with the overall market narrative.
๐ก Core Philosophy
โCapital management, discipline, and consistency create longevity.โ
A strong risk-to-reward model, paired with high-probability execution, is the foundation of sustainable trading ๐๐
โ ๏ธ Understanding Losses
"Losses are part of the game" โ a mathematical certainty ๐ฒ
They donโt define performance. Nor do they define you as a Trader.
They are managed, reviewed, and used as evidence for growth ๐
๐ Final Note
Appreciate you taking the time to review todayโs forecast.
Stay disciplined ๐ฏ
Protect your capital ๐
โ FRGNT ๐๐
๐ Disclaimer
This content is provided for educational purposes only and does not constitute financial advice.
It reflects my personal approach to the markets โ a tested framework that has supported my own journey toward consistent profitability in currency trading.
Please understand that any forecasts shared are not financial advice. I will be looking for confirmation in line with my setup model and specific entry criteria from the key areas identified on the chart.
All analysis, whether presented via image or video, is shared strictly for educational insight and is not intended to breach any TradingView House Rules.
FX:USDJPY
GBPUSD | Q3 | W29 | D13 | Y26 |๐| Q3 | W29 | D13 | Y26 |
๐| GBPUSD |
๐ก| FRGNT DAILY CHART ANALYSIS |
This forecast is built using an advanced adaptation of Smart Money Concepts, with a structured and disciplined approach:
โข Marking Key Points of Interest (POIs) on Higher Time Frames (HTFs) ๐ฐ๏ธ
โข Defining a clear, controlled trading range from those zones ๐
โข Refining entries on Lower Time Frames (LTFs) ๐
โข Waiting for confirmed Break of Structure (BoS) before execution โ
This process ensures precision, removes emotional decision-making, and keeps me aligned with the overall market narrative.
๐ก Core Philosophy
โCapital management, discipline, and consistency create longevity.โ
A strong risk-to-reward model, paired with high-probability execution, is the foundation of sustainable trading ๐๐
โ ๏ธ Understanding Losses
"Losses are part of the game" โ a mathematical certainty ๐ฒ
They donโt define performance. Nor do they define you as a Trader.
They are managed, reviewed, and used as evidence for growth ๐
๐ Final Note
Appreciate you taking the time to review todayโs forecast.
Stay disciplined ๐ฏ
Protect your capital ๐
โ FRGNT ๐๐
๐ Disclaimer
This content is provided for educational purposes only and does not constitute financial advice.
It reflects my personal approach to the markets โ a tested framework that has supported my own journey toward consistent profitability in currency trading.
Please understand that any forecasts shared are not financial advice. I will be looking for confirmation in line with my setup model and specific entry criteria from the key areas identified on the chart.
All analysis, whether presented via image or video, is shared strictly for educational insight and is not intended to breach any TradingView House Rules.
FX:GBPUSD
| DXY | CONFLUENCE INDEX | Q3 | W29 | D13 | Y26 |๐| Q3 | W29 | D13 | Y26 |
๐| DXY | CONFLUENCE INDEX |
๐ก| FRGNT DAILY CHART ANALYSIS |
This forecast is built using an advanced adaptation of Smart Money Concepts, with a structured and disciplined approach:
โข Marking Key Points of Interest (POIs) on Higher Time Frames (HTFs) ๐ฐ๏ธ
โข Defining a clear, controlled trading range from those zones ๐
โข Refining entries on Lower Time Frames (LTFs) ๐
โข Waiting for confirmed Break of Structure (BoS) before execution โ
This process ensures precision, removes emotional decision-making, and keeps me aligned with the overall market narrative.
๐ก Core Philosophy
โCapital management, discipline, and consistency create longevity.โ
A strong risk-to-reward model, paired with high-probability execution, is the foundation of sustainable trading ๐๐
โ ๏ธ Understanding Losses
"Losses are part of the game" โ a mathematical certainty ๐ฒ
They donโt define performance. Nor do they define you as a Trader.
They are managed, reviewed, and used as evidence for growth ๐
๐ Final Note
Appreciate you taking the time to review todayโs forecast.
Stay disciplined ๐ฏ
Protect your capital ๐
โ FRGNT ๐๐
๐ Disclaimer
This content is provided for educational purposes only and does not constitute financial advice.
It reflects my personal approach to the markets โ a tested framework that has supported my own journey toward consistent profitability in currency trading.
Please understand that any forecasts shared are not financial advice. I will be looking for confirmation in line with my setup model and specific entry criteria from the key areas identified on the chart.
All analysis, whether presented via image or video, is shared strictly for educational insight and is not intended to breach any TradingView House Rules.
TVC:DXY
Gold prices will continue to fall belowResistance: 4110/4123/4138. Support: 4052/4033/4012
My suggestions:
BUY: 4020-4030, SL: 4000, TP: 4090-4120;
SELL: 4110-4120, SL: 4140, TP: 4050-4020;
With the renewed geopolitical tensions over the weekend and the closure of the Strait of Hormuz, the market has experienced significant changes. After Monday's opening, the US dollar rose, and gold opened lower and continued to weaken, entering a period of weak consolidation. Therefore, it is unlikely that gold will return to an uptrend in the near term, and a bearish outlook is maintained. To put it simply, gold lacks the conditions for an upward move and will continue its downward consolidation below 4200. This week, gold can be bought low and sold high; there's no need to worry about a single-sided trend!
On the daily chart, the 10-day and 7-day moving averages are converging, and the RSI indicator remains below the 50 level. Gold prices are facing resistance from the middle Bollinger Band and the 7-day moving average at 4120. On the shorter-term 1-hour and 4-hour charts, the moving averages are crossing downwards, the price is trading between the middle and lower Bollinger Bands, and the RSI is below 50. Technically, gold remains in a downtrend.
Beware of Retail Support and ResistanceI don't see any reason to short here. People love seeing "resistance". If price bounced there before, how could it not bounce again, right? Then they try to trade there and blow up their account in no time. This kind of thinking is very dangerous because it's static and markets evolve dynamically (see my last post).
If someone shorts at what later gets identified as "an important resistance level", how do we know that participant didn't exit his position once price went down, and why would we assume he'll sell more or that more sellers will show up in the area?
A more appropriate way of trading and looking at markets starts with identifying the trend instead of levels where price bounced before, and then determining what makes sense to do in that market. In this case, it's clear that it's going up, and the more appropriate play is to buy at support. Not because it already bounced there before, and not because support is high probability, since there's also an enormous number of people who go around saying "this is high probability," and it's all made up; they actually can't give you a number even by accident. The truth is that, if they have any risk-to-reward, what they are seeing is, at best, 50/50.
Furthermore, a line or trading context having prior validation, under certain circumstances, actually makes the trade worse instead of better, because it's the direct observation that other people already traded before us, and why would they have incentives to keep trading each time at worse prices? They might, or they might not.
Let's look at where they already traded:
Does this make it more reliable, safer, a better trade? Not necessarily. That's generally where I want to trade. Now that I know there are already people well positioned there, why would I assume that those people would re-accumulate Bitcoin at worse prices? It can happen, or it may not. People who talk about "high probability" because of this or that variable generally don't have the slightest idea what they're talking about. At best, they might scrape one unit of risk (the same as what they're risking) with a probability slightly above 50%, but that's about it, and if they have any risk-to-reward, believe me, if they have a 60% win rate, it's basically a miracle.
Markets don't increase probabilities by having more of something: more bounces, more stop runs, more patterns of whatever it may be. Probabilities change at the precise moment when a side that was imbalanced in one direction loses that "strength" at a critical point and the opposite side becomes imbalanced in its direction and regains control, typically at extremes. That's the real economic mechanism.
That's what we constantly trade in this system and call "Test and Retest".
When prices reach an extreme, we don't know if they can continue to the stop or reverse; that's the "test".
If that test then produces the reaction that we have measured across thousands of cases, then we know that, in the general case, the phenomenon that occurred there is that basic economic phenomenon of supply and demand, where one side of the equation is in a situation where it's no longer economically favorable to keep doing more of the same. Meaning, if, for example, prices have been going down, by the law of supply and demand we know buyers will tend to appear instead of sellers, and the curve tends to shift and subsequently balance out. That's essentially what we measure, which is exactly the same thing high-frequency algorithms measure when they're scanning the order book looking for imbalances and volatility, except instead of doing it on such a small scale looking to grab a few ticks, like those algorithms do (including Market Makers), we want to grab a multiple of what we're risking.
Given the conditions we're looking for and that we have measured for the general case (Law of Large Numbers), only then do we enter on a retest at the calculated point. Without worsening our price by chasing it. Placing limit orders so that price comes to us where we already know a new imbalance was generated in the direction of our trade, the "test with good separation" that happens at the extreme.
What does this have to do with how many times price bounced before? As far as I know, absolutely nothing. Furthermore, as I said, sometimes it can even worsen the scenario, because if there are people who already traded before, maybe they have no incentive to accumulate more inventory of whatever it is; maybe they got out, or maybe the numbers no longer work for them.
Buy at support, the lower extreme; sell at resistance, the upper extreme, if there's confirmation from the market that it's re-accumulating, and most important of all, if it fits our Money Management and Risk Management numbers, meaning the size of the stop, where we place it, and how much we get paid for the trade.
Jenkins Vectors and Channels = Better Time Reversal Indicator? I was charting AMEX:KWEB and was looking for Jenkins Vectors that gave good confluence, and to predict future turning points.
Interesting to note that a very clean channel gave a very clean top time indicator, when using the Jenkins Vector strategy.
A tool to add to our playbook.
==========================
Interested in more TA like this? Like and comment to let me know so I can post more.
Gold Pullback or the Next Bull Run?Gold just flushed into a high confluence demand zone, but the bigger picture hasn't changed.
I'm still positioned on this setup, trading it with 500x leverage on CFDs . With leverage this high, risk management matters far more than being right. The setup is attractive because multiple technical and macro factors are aligning, not because leverage guarantees returns.
Why Gold Still Looks Strong
Geopolitical uncertainty continues to support safe haven demand. Ongoing conflicts, trade tensions, and broader global uncertainty have kept investors interested in defensive assets whenever risk sentiment weakens.
At the same time, markets remain highly sensitive to inflation expectations and central bank policy. Any shift toward lower real yields or expectations of future rate cuts tends to benefit gold. That macro backdrop is one reason I'm treating this sell-off as a potential buying opportunity instead of assuming the trend has already reversed.
Technical Structure
The higher-timeframe trend remains bullish despite the recent correction. Price has retraced directly into a Fair Value Gap (FVG) while approaching a major horizontal support zone around 4,070.
This area stands out because it combines:
Fair Value Gap support
Previous market structure
High-volume traded region
Discount pricing within the recent swing
Potential liquidity sweep before continuation
Confluence matters more than any single indicator.
Volume Profile Analysis
The Volume Profile tells an important story. Most trading activity has accumulated around the 4100-4125 region, showing this is a significant value area where buyers and sellers have repeatedly agreed on price.
The current decline pushed price below that value area into relatively lower volume territory. Markets often reject these low-volume areas quickly if buyers return, making them attractive zones for potential reversals.
If buyers reclaim the Value Area, momentum could accelerate as price moves back toward acceptance.
Bullish Scenario
The ideal sequence would be:
Liquidity sweep into the FVG
Strong bullish reaction
Recovery above 4103
Break above 4136 resistance
Retest of the descending trendline near 4135
Trend continuation if buyers reclaim higher value
Bearish Scenario
The bullish thesis weakens if:
FVG fails to hold
4034 support breaks decisively
Selling volume expands below support
That would likely open the door for a deeper correction before buyers return.
My Trade Plan
Entry Zone
4,070-4,080 (FVG)
Invalidation
Below 4,034
Upside Targets
4136
4145
Higher if trendline breaks with volume
Final Thoughts
This isn't just an FVG trade. It's a setup where market structure, volume profile, liquidity, macro uncertainty, and safe haven demand all point to the same area. Those are the trades worth waiting for.
I'm trading this with 500x leverage, which requires extremely tight risk control because even small price moves can lead to significant gains or losses. The leverage is part of my strategy, not the reason for the trade.
Disclaimer: This analysis reflects my market view and is for educational purposes only. It is not financial advice.
TSLA 1H โ Descending Trendline Breakout Eyes $430 Resistance
Tesla (TSLA) is trading inside a broader downtrend but is showing signs of strength as price challenges a long-term descending trendline. The chart highlights multiple rejections from this trendline, making it a significant resistance level.
Price is currently consolidating around the Ichimoku Cloud near **$407โ411**. A sustained breakout and close above both the cloud and the descending trendline would confirm bullish momentum and increase the probability of a move toward the next key resistance.
The green support zone around **$370** remains the major demand area. As long as price stays above this support, buyers retain the opportunity to push higher.
### **Bullish Target:**
* ๐ฏ **Primary Target:** **$430.00**
* ๐ A confirmed breakout above the descending trendline could open the path toward the **$430 resistance zone**.
### **Key Levels:**
* **Resistance:** $411.00 โ Trendline Breakout โ **$430.00**
* **Support:** **$370.00**
**Trading Idea:**
Wait for a strong hourly candle to close above the descending trendline and the Ichimoku Cloud before considering bullish continuation. Failure to break the trendline may lead to another rejection and a retest of lower support levels. Proper risk management and confirmation are recommended before entering any trade.
Ford - Looking for a buying opportunityPotential support at the lower parallel.
If it is broken to the downside, the only potential support remaining would be two lows, one at 8 and the other at 4.
I expect that if price trades near the lower parallel, it will bounce higher to confirm that there are buyers and allow me to trade in that direction.
| GBPUSD | HTF FORECAST AND ANALYSIS | Q3 | W29 | Y26 |๐| Q3 | W29 | Y26 |
๐| GBPUSD | HTF FORECAST AND ANALYSIS |
๐ก| FRGNT DAILY CHART ANALYSIS |
This forecast is built using an advanced adaptation of Smart Money Concepts, with a structured and disciplined approach:
โข Marking Key Points of Interest (POIs) on Higher Time Frames (HTFs) ๐ฐ๏ธ
โข Defining a clear, controlled trading range from those zones ๐
โข Refining entries on Lower Time Frames (LTFs) ๐
โข Waiting for confirmed Break of Structure (BoS) before execution โ
This process ensures precision, removes emotional decision-making, and keeps me aligned with the overall market narrative.
๐ก Core Philosophy
โCapital management, discipline, and consistency create longevity.โ
A strong risk-to-reward model, paired with high-probability execution, is the foundation of sustainable trading ๐๐
โ ๏ธ Understanding Losses
"Losses are part of the game" โ a mathematical certainty ๐ฒ
They donโt define performance. Nor do they define you as a Trader.
They are managed, reviewed, and used as evidence for growth ๐
๐ Final Note
Appreciate you taking the time to review todayโs forecast.
Stay disciplined ๐ฏ
Protect your capital ๐
โ FRGNT ๐๐
๐ Disclaimer
This content is provided for educational purposes only and does not constitute financial advice.
It reflects my personal approach to the markets โ a tested framework that has supported my own journey toward consistent profitability in currency trading.
Please understand that any forecasts shared are not financial advice. I will be looking for confirmation in line with my setup model and specific entry criteria from the key areas identified on the chart.
All analysis, whether presented via image or video, is shared strictly for educational insight and is not intended to breach any TradingView House Rules.
FX:GBPUSD
| DXY | HTF FORECAST AND ANALYSIS | FRGNT DAILY CHART ANALYSIS ๐| Q3 | W29 | Y26 |
๐| DXY | HTF FORECAST AND ANALYSIS |
๐ก| FRGNT DAILY CHART ANALYSIS |
This forecast is built using an advanced adaptation of Smart Money Concepts, with a structured and disciplined approach:
โข Marking Key Points of Interest (POIs) on Higher Time Frames (HTFs) ๐ฐ๏ธ
โข Defining a clear, controlled trading range from those zones ๐
โข Refining entries on Lower Time Frames (LTFs) ๐
โข Waiting for confirmed Break of Structure (BoS) before execution โ
This process ensures precision, removes emotional decision-making, and keeps me aligned with the overall market narrative.
๐ก Core Philosophy
โCapital management, discipline, and consistency create longevity.โ
A strong risk-to-reward model, paired with high-probability execution, is the foundation of sustainable trading ๐๐
โ ๏ธ Understanding Losses
"Losses are part of the game" โ a mathematical certainty ๐ฒ
They donโt define performance. Nor do they define you as a Trader.
They are managed, reviewed, and used as evidence for growth ๐
๐ Final Note
Appreciate you taking the time to review todayโs forecast.
Stay disciplined ๐ฏ
Protect your capital ๐
โ FRGNT ๐๐
๐ Disclaimer
This content is provided for educational purposes only and does not constitute financial advice.
It reflects my personal approach to the markets โ a tested framework that has supported my own journey toward consistent profitability in currency trading.
Please understand that any forecasts shared are not financial advice. I will be looking for confirmation in line with my setup model and specific entry criteria from the key areas identified on the chart.
All analysis, whether presented via image or video, is shared strictly for educational insight and is not intended to breach any TradingView House Rules.
TVC:DXY
| GBPUSD | 15' BULLISH & 4H | SHORT CONFIRMATION POTENTIAL ๐| Q3 | W28 | D10 | Y26 |
๐| GBPUSD | 15' & 4H BULLISH | SHORT CONFIRMATION POTENTIAL
๐ก| FRGNT DAILY CHART ANALYSIS |
This forecast is built using an advanced adaptation of Smart Money Concepts, with a structured and disciplined approach:
โข Marking Key Points of Interest (POIs) on Higher Time Frames (HTFs) ๐ฐ๏ธ
โข Defining a clear, controlled trading range from those zones ๐
โข Refining entries on Lower Time Frames (LTFs) ๐
โข Waiting for confirmed Break of Structure (BoS) before execution โ
This process ensures precision, removes emotional decision-making, and keeps me aligned with the overall market narrative.
๐ก Core Philosophy
โCapital management, discipline, and consistency create longevity.โ
A strong risk-to-reward model, paired with high-probability execution, is the foundation of sustainable trading ๐๐
โ ๏ธ Understanding Losses
"Losses are part of the game" โ a mathematical certainty ๐ฒ
They donโt define performance. Nor do they define you as a Trader.
They are managed, reviewed, and used as evidence for growth ๐
๐ Final Note
Appreciate you taking the time to review todayโs forecast.
Stay disciplined ๐ฏ
Protect your capital ๐
โ FRGNT ๐๐
๐ Disclaimer
This content is provided for educational purposes only and does not constitute financial advice.
It reflects my personal approach to the markets โ a tested framework that has supported my own journey toward consistent profitability in currency trading.
Please understand that any forecasts shared are not financial advice. I will be looking for confirmation in line with my setup model and specific entry criteria from the key areas identified on the chart.
All analysis, whether presented via image or video, is shared strictly for educational insight and is not intended to breach any TradingView House Rules.
FX:GBPUSD
| USDCAD | SHORT BIAS | Q3 | W28 | D10 | Y26 |๐| Q3 | W28 | D10 | Y26 |
๐| USDCAD | SHORT BIAS |
๐ก| FRGNT DAILY CHART ANALYSIS |
This forecast is built using an advanced adaptation of Smart Money Concepts, with a structured and disciplined approach:
โข Marking Key Points of Interest (POIs) on Higher Time Frames (HTFs) ๐ฐ๏ธ
โข Defining a clear, controlled trading range from those zones ๐
โข Refining entries on Lower Time Frames (LTFs) ๐
โข Waiting for confirmed Break of Structure (BoS) before execution โ
This process ensures precision, removes emotional decision-making, and keeps me aligned with the overall market narrative.
๐ก Core Philosophy
โCapital management, discipline, and consistency create longevity.โ
A strong risk-to-reward model, paired with high-probability execution, is the foundation of sustainable trading ๐๐
โ ๏ธ Understanding Losses
"Losses are part of the game" โ a mathematical certainty ๐ฒ
They donโt define performance. Nor do they define you as a Trader.
They are managed, reviewed, and used as evidence for growth ๐
๐ Final Note
Appreciate you taking the time to review todayโs forecast.
Stay disciplined ๐ฏ
Protect your capital ๐
โ FRGNT ๐๐
๐ Disclaimer
This content is provided for educational purposes only and does not constitute financial advice.
It reflects my personal approach to the markets โ a tested framework that has supported my own journey toward consistent profitability in currency trading.
Please understand that any forecasts shared are not financial advice. I will be looking for confirmation in line with my setup model and specific entry criteria from the key areas identified on the chart.
All analysis, whether presented via image or video, is shared strictly for educational insight and is not intended to breach any TradingView House Rules.
FX:USDCAD
| USDCAD +3% | GBPUSD +3% | FRGNT FUN COUPON FIRDAY | REVIEW๐| Q3 | W28 | D10 | Y26 |
๐| USDCAD +3% | GBPUSD +3% |
๐ก| FRGNT FUN COUPON FIRDAY | TRADE REVIEW
This forecast is built using an advanced adaptation of Smart Money Concepts, with a structured and disciplined approach:
โข Marking Key Points of Interest (POIs) on Higher Time Frames (HTFs) ๐ฐ๏ธ
โข Defining a clear, controlled trading range from those zones ๐
โข Refining entries on Lower Time Frames (LTFs) ๐
โข Waiting for confirmed Break of Structure (BoS) before execution โ
This process ensures precision, removes emotional decision-making, and keeps me aligned with the overall market narrative.
๐ก Core Philosophy
โCapital management, discipline, and consistency create longevity.โ
A strong risk-to-reward model, paired with high-probability execution, is the foundation of sustainable trading ๐๐
โ ๏ธ Understanding Losses
"Losses are part of the game" โ a mathematical certainty ๐ฒ
They donโt define performance. Nor do they define you as a Trader.
They are managed, reviewed, and used as evidence for growth ๐
๐ Final Note
Appreciate you taking the time to review todayโs forecast.
Stay disciplined ๐ฏ
Protect your capital ๐
โ FRGNT ๐๐
๐ Disclaimer
This content is provided for educational purposes only and does not constitute financial advice.
It reflects my personal approach to the markets โ a tested framework that has supported my own journey toward consistent profitability in currency trading.
Please understand that any forecasts shared are not financial advice. I will be looking for confirmation in line with my setup model and specific entry criteria from the key areas identified on the chart.
All analysis, whether presented via image or video, is shared strictly for educational insight and is not intended to breach any TradingView House Rules.