SEPTEMBER 11 Bitcoin chart analysis.Hello
It's a Bitcoin Guide.
My analysis is optimized for TradingView.
If you press the Replay button, you can check real-time movements.
This is the 30-minute Bitcoin chart.
At the bottom left, I have maintained the strategy for the long position entry point of $76,999.4 (marked with a purple finger), which was established on September 10th.
The CPI data release is scheduled for 9:30 shortly.
*Long position strategy regarding the upper "Purple Finger 1" zone:
1) After confirming a touc
Gann
When Market Behavior ChangesMarkets develop short-term habits. During a strong trend, pullbacks may remain shallow, buyers may respond quickly near recent lows, and every recovery may reach a new high without requiring much time.
Those habits create a baseline. When they begin changing, traders can sometimes see deterioration before the larger structure actually breaks.
Suppose CRYPTOCAP:BTC has been trending higher for several weeks. Most corrections have been around 2–3%, lasted less than a day, and recovered quickly
TXN NEW ALL TIME HIGHTXN is attempting to recover from the lower boundary of a multi-month Bullish Wedge. The $270-$276 resistance zone remains the key level to watch. A breakout above this area could trigger a larger reversal toward $285 and $311, while rejection would likely keep the stock trading within its current corrective structure. Bulls have regained short-term momentum, but confirmation requires a decisive move through trendline resistance.
Levels to Watch
✅ Bullish Trigger: $274
🎯 Targets: $285 → $311 →
NIFTY SENTIMEnt ANALYSIS FOR 21/09/2026🚨 **NIFTY 21 SEP 2026 — THE BATTLEFIELD IS SET**
### PRE-MARKET SENTIMENT
🟢 **STRONG BULLISH**
⚡ **EXPLOSIVE BEHAVIOUR**
🟠 **CE DOMINANT**
This is the hypothesis.
Now let **price validate or invalidate it.**
### 📍 KEY LEVELS
**Opening Reference:** 23,328.05
🛡️ Support: **23,331.55**
⚔️ Key Resistance: **23,387**
🎯 Resistance 2: **23,447**
🚀 Major Resistance: **23,497.75**
### ⏰ TIME ANCHOR
**12:45 PM**
This is the key observation window for today's map.
### 🏆 SECTOR SENTIMENT
🥇 **
XAU/USD: Market Analysis and Strategy for September 21Looking ahead at the gold price trend for the next 15 days, current market dynamics indicate that pricing logic has shifted away from a sole focus on interest rate expectations; instead, the market is now weighing a complex mix of factors, including fiscal conditions, inflation levels, geopolitical conflicts, and global asset allocation. If external markets continue to provide support for gold prices, gold is likely to maintain a high-level consolidation pattern in the short term.
From a techni
BTCUSD-SELL strategy Daily Chart Reg ChannelFriday's idea to buy into 75-78$ zone is fine, but profit taking should be scaled lower towards $ 84-85 k. Today I feel we should be selling near $ 83-85 k zone, since overall we still have the "false bull flag pattern" plus tr4ading above the reg. channel suggests we are still southward move in the near future, is my personal view point.
Strategy SELL @ $ 84-85 k and take profit near $ 61.5 k for now.
BTC | Crucial area after breaking the upward structureOn the daily frame, Bitcoin emerged from the main up-up channel that had dominated the movement since 2023, and after the summit near 120,000–125,000 it began to form a relatively clear downward structure.
Currently, the price is around 81,250, and the most important thing I observe is the area of 80,000–82,000; because it represents a decisive level for the continuation of the rebound or the return of selling pressure.
Significant levels:
● 🟢 81,500–82,000: Current test region.
● 🔴 90,000
PepsiCo (PEP) – Bearish Setup | Target: 127.70 #55PEP Price Outlook: PepsiCo, Inc. Breaks Below 0.786 Support Arc | Potential Decline Toward 127.70
PepsiCo, Inc. (PEP): Arc Cycle Analysis™
Overview: Based on Arc Cycle Analysis applied to the 4h chart, PepsiCo, Inc. has broken below the 0.786 Support Arc within the current Arc Cycle. The breakdown confirms a bearish shift in price structure and opens the potential for continued movement toward the next Support Arc.
Market Outlook
Price has broken below the 0.786 Support Arc, confirming a be
**XAUUSD 4H: Liquidity Sweep at 4H Fractal or Bearish Rejection?
**Gold (XAUUSD) 4H Outlook | Smart Money Structure**
Price is currently printing a clean curved recovery curve into a heavy resistance & liquidity cluster on the 4-Hour timeframe. Here is the structural breakdown:
* **Key Zone / 4H Fractal ($4,442 – $4,445):**
Major buy-side liquidity pool ($$$) resting above recent highs. We are anticipating a potential **liquidity sweep / fakeout** into the $4,445 level before sellers step back in.
* **Bearish Scenario (Primary):**
If price taps into the
MSFT Volume Drying Up as Price TightensNASDAQ:MSFT ran from the 390s into the 510s before entering a consolidation phase. Price is now compressing within a flag while the 20-day MA remains above the 200-day MA, keeping the longer-term trend constructive.
Volume has been drying up during the consolidation, which often signals that a larger move may be approaching as buyers and sellers reach equilibrium. The key level I'm watching is 465 to 485. Holding above that zone would support the bullish structure, while a breakdown could ope
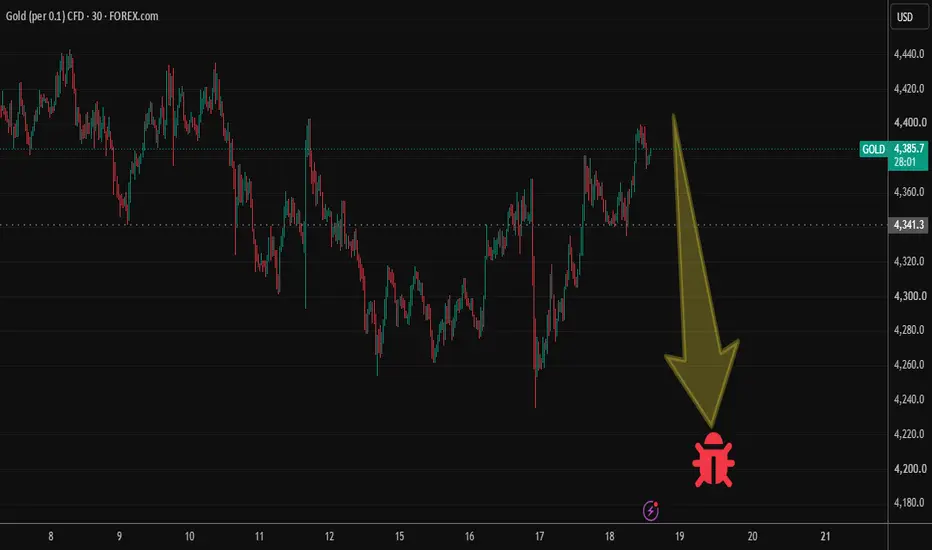
XAUUSD | 30M Timeframe | Repetition Of Structure MethodMarkets don't move randomly — they move in repeating structural blocks. Every strong impulsive move originates from a specific price range where a large quantity of orders (institutional supply or demand) was absorbed before price expanded away. This origin range is the Quantity Box (QB).
The theory behind QB is simple: when price returns to revisit a zone that shares the same structural characteristics as a previous QB (similar range size, similar consolidation behavior, similar location relat
BTCUSD-NEUTRAL BUY strategy Daily cart GANNThere is some start of a potential move higher (short-term) towards $ 88-90 k.
We are holding GANN support and we are positive on some indicators, and since GOLD is recovering, we may see some price movement benefit for BTC short-term.
Strategy BUY current $ 75-78 k and take profit near $ 87 k for now.
EURUSD Tests 0.786 Arc | Awaiting Directional Confirmation Based on Arc Cycle Analysis applied to the 1h chart, Euro / U.S. Dollar is interacting with the 0.786 Arc within the current Arc Cycle. Price remains centered around this Arc, indicating that directional confirmation has not yet been established
Location Gives Candles MeaningA bearish engulfing candle, hammer or long rejection wick can look convincing on a chart, but the shape itself tells you very little about whether the reaction actually matters.
The first question should be: where did it happen?
Suppose CRYPTOCAP:BTC prints a large bearish engulfing candle after moving from $78,000 to $80,000. If it forms somewhere in the middle of a range where price has already traded repeatedly, it may simply represent another short-term rotation between buyers and seller