Gann
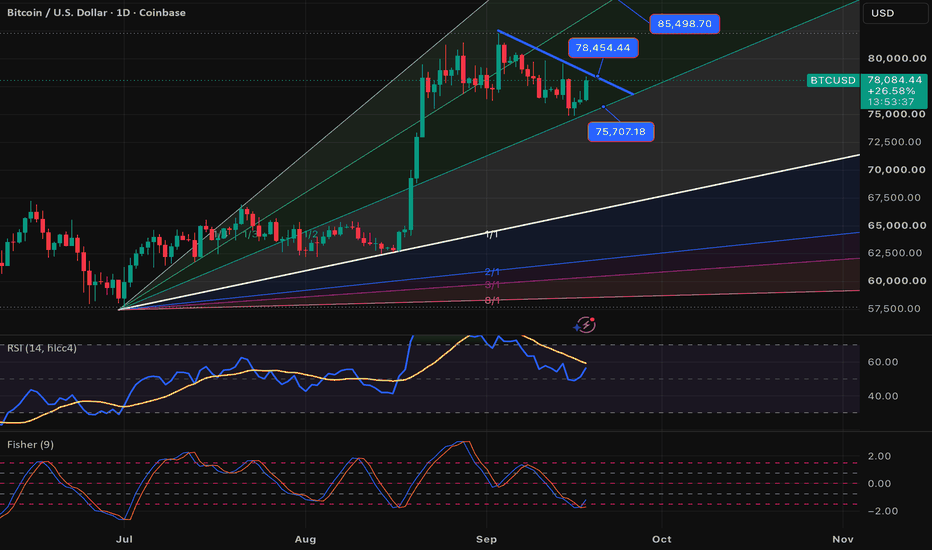
BTCUSD-NEUTRAL BUY strategy Daily cart GANNThere is some start of a potential move higher (short-term) towards $ 88-90 k.
We are holding GANN support and we are positive on some indicators, and since GOLD is recovering, we may see some price movement benefit for BTC short-term.
Strategy BUY current $ 75-78 k and take profit near $ 87 k for now.
EURUSD Tests 0.786 Arc | Awaiting Directional Confirmation Based on Arc Cycle Analysis applied to the 1h chart, Euro / U.S. Dollar is interacting with the 0.786 Arc within the current Arc Cycle. Price remains centered around this Arc, indicating that directional confirmation has not yet been established
Location Gives Candles MeaningA bearish engulfing candle, hammer or long rejection wick can look convincing on a chart, but the shape itself tells you very little about whether the reaction actually matters.
The first question should be: where did it happen?
Suppose CRYPTOCAP:BTC prints a large bearish engulfing candle after moving from $78,000 to $80,000. If it forms somewhere in the middle of a range where price has already traded repeatedly, it may simply represent another short-term rotation between buyers and seller
NIFTY SENTIMENT ANALYSIS FOR 18 SEPTEMBER 2026# NIFTY SENTIMENT ANALYSIS | 18 SEP 2026
## 🚨 PESSIMISM IS THE NEW REALITY — BUT IS THE MARKET REALLY BEARISH?
The final sentiment analysis of the week comes with an interesting contradiction:
🟢 **Bias:** MILD BULLISH
⚠️ **Character:** TRAP / CONFLICT
⚡ **Behaviour:** EXPLOSIVE
🟠 **Options Bias:** PE DOMINANT
So this is **not a clean bullish setup**.
It is a bullish bias operating inside a pessimistic market.
---
## 🎯 TODAY'S KEY LEVELS
**23,331.25** — Opening Reference
🟢 **23,275** — Ke
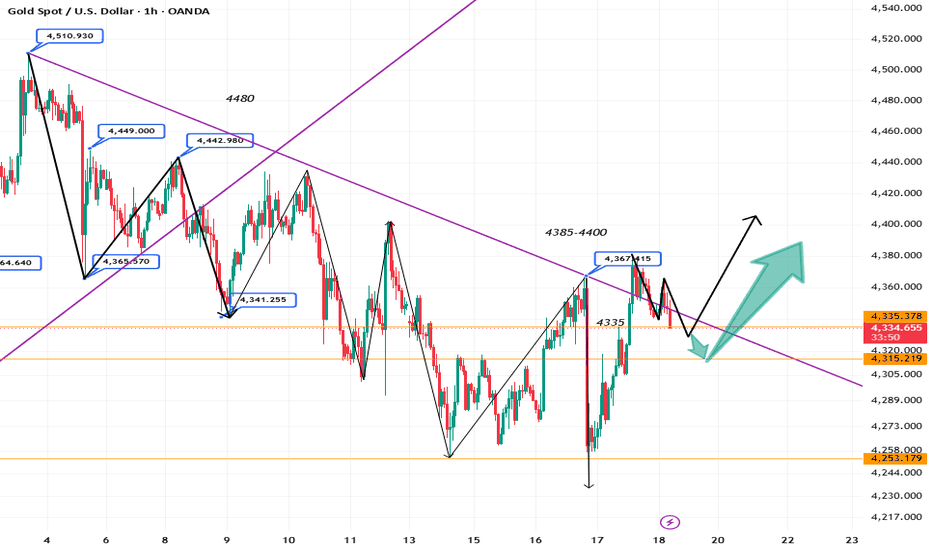
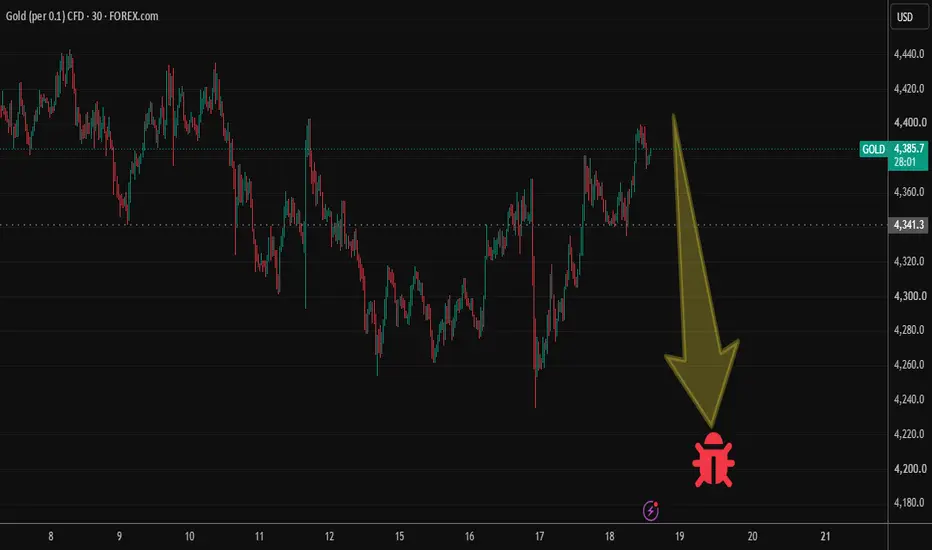
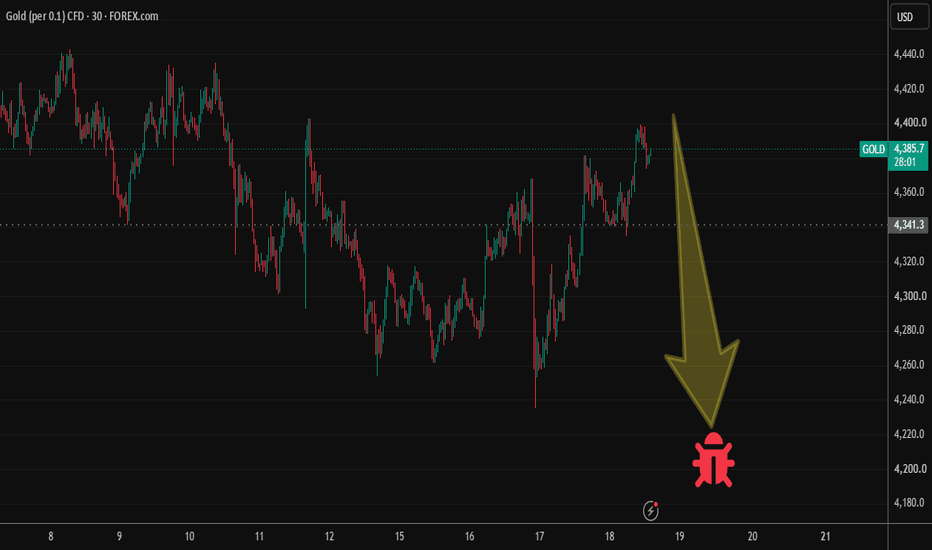
XAU/USD: Market Analysis and Strategy for September 18Looking at this week's performance, gold declined over three days. Following the Federal Reserve's interest rate hike, the price of gold dropped sharply as the bearish news was priced in. Yesterday, during the Asian session, gold rose with support from the 60-day moving average (MA60) at $4,257 and continued to climb during the European session; it reached $4,380 during the US session before pulling back to close at $4,340. The MACD bearish momentum bars have significantly contracted, indicating
Gold trading ideaHi all,
we came back today with a strong Gold view for next hours,
we're expecting a heavy short on gold from 4352 to first 4248 then finally 4146 that would be the two TPs to targert pay attention though to the high volatility expected due to interests rates ... we have no idea why would the gold fall first even though the news are against the dollar for a possible fixed rates senario but the techichal says is it all on the chart from 4146 expect another move up you can start buy from there un
Polygon OMS Powers Stablecoin Bank Transfers Across 180Stable com has integrated Polygon’s OMS, enabling stablecoin transfers across 180 countries. This development highlights the growing trend towards seamless digital currency transactions. As reported by the influencer @0xPolygon, users can now move USDT or PYUSD directly from their wallets into bank accounts, significantly enhancing accessibility in the crypto space. This move is expected to attract more users to the Polygon network and increase transaction volumes.
What Went Down
The integratio
Trading Roadmap | Gann · Lesson 01 — Price and TimeLesson 01 - Price and Time
Difficulty: (Beginner)
A new course starts here. Almost every tool covered so far answers one question: how far did price travel? The work of W.D. Gann is built on a second question that most charts never ask out loud — how long did it take, and are the two in proportion? This lesson is about that idea, about the man who built a method around it, and about which parts of that method are worth carrying into a modern chart.
One advance, measured twice. The v
USDCHF Price Forecast: Potential Advance Toward 0.8291USDCHF Price Forecast: U.S. Dollar / Swiss Franc Breaks Above 1 (100%) Arc | Potential Advance Toward 0.8291
Market Outlook
Price has broken above the 1 (100%) Resistance Arc, confirming a bullish breakout within the current Arc Cycle.
A sustained breakout above the Resistance Arc supports continued movement toward 0.8291 price. Conversely, a sustained 2h close back below 0.8240 would weaken the breakout scenario and could shift the outlook back toward the previous Support Arc.
XAU/USD: Market Analysis and Strategy for September 17Looking ahead at the gold price outlook for the next 15 days, market focus will shift to a series of economic data releases on Thursday: initial jobless claims, the Philadelphia Fed Manufacturing Index, and housing starts. If the U.S. economy continues to demonstrate resilience, the market will likely anticipate a continuation of the Federal Reserve's tightening policy; consequently, U.S. Treasury yields and the U.S. dollar are expected to remain elevated, continuing to exert downward pressure o
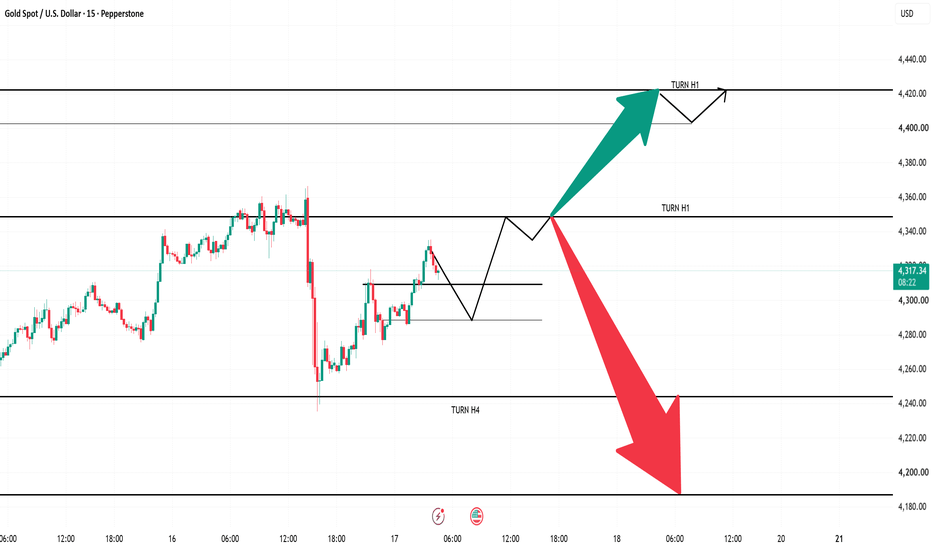
XAUUSD – COMPRESSED 4,289–4,347, AWAITING NEWSYour chart matches line for line: compression band 4,290–4,310, TURN H1 at 4,350 and 4,420, TURN H4 4,240 , green arrow to 4,420 and red arrow down to ~4,190. Live price 4,318.83 , session range 4,275–4,367 .
Macro worth noting: FOMC hiked 25bp to 3.75–4.00% overnight and signalled more to come. DXY reclaimed 100.27–100.31 , US10Y closed at 5.004% – a 19-year high. Yet gold still hasn't collapsed despite every headline being negative – meaning structural demand is holding underneath.
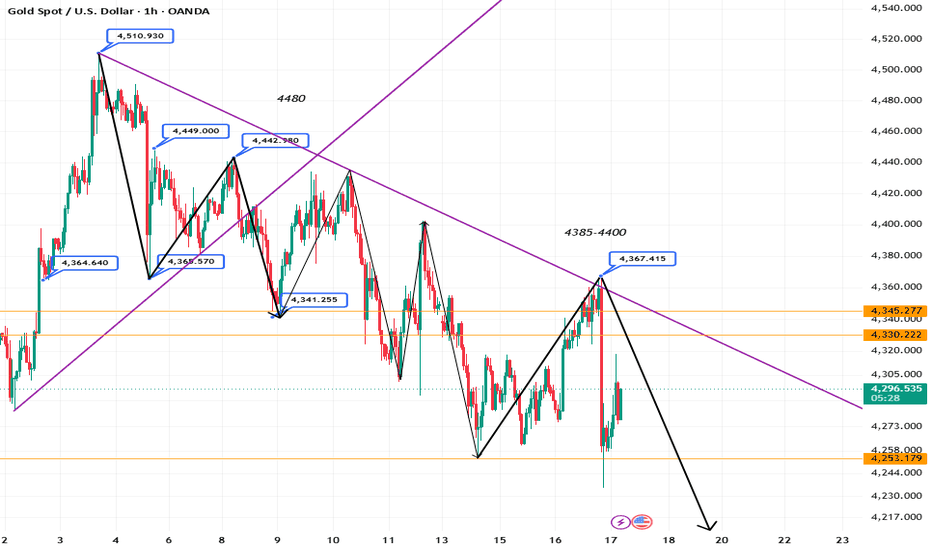
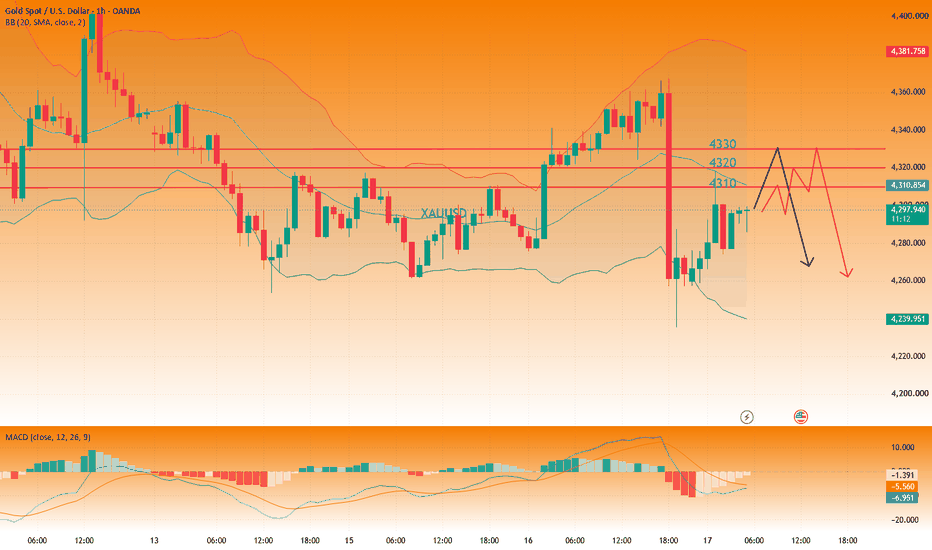
XAUUSD | Bearish Retest SetupGold prices rebounded from the 4232 area to 4296, but after a sharp sell-off of more than $130, the current recovery is still considered a corrective bounce.
A key shift has occurred: the 4300 level has flipped from support to resistance.
Looking at the 4-hour chart, 4310 is the first supply zone, while there is stronger resistance around 4320–4330.
The preferred strategy is to sell into rallies rather than chasing the downside. Aggressive traders might establish small positions in the 4310–43
XAUUSD | Potential Breakdown Toward 4,212XAUUSD Price Outlook: Gold Spot / U.S. Dollar Pressing Against 1 (100%) Support Arc | Potential Breakdown Toward 4,212
Market Outlook
Price is testing the 1 (100%) Support Arc, where continued selling pressure may result in a breakdown toward the next Support Arc. A sustained breakdown below the Support Arc would support continued movement toward 4,212 price.
Conversely, a sustained 2h close above 4,320, would invalidate the bearish scenario and could shift the outlook back toward the upper Re
NIFTY SENTIMENt ANALYSIS FOR 17/09/2026# NIFTY SENTIMENT ANALYSIS | 17 SEP 2026
## STRONG BULLISH — NOW LET PRICE PROVE IT
Today's two-engine reading is aligned:
🟢 **Hybrid:** Bullish | Strong Bullish
🔥 **Unified:** Strong Bullish
⚡ **Force Score:** +8
💥 **Behaviour:** Explosive
🟢 **CE Dominant**
### 🎯 KEY PRICE LEVELS
**23,196.40** — Opening Reference
**23,252** — First Resistance
**23,308** — Major Resistance
**23,364** — Higher Resistance
**23,193.65** — Immediate Support
At the time of analysis:
**NIFTY: 23,242.30**
Pric
Liquidity Sweep Dip & Macro Expansion to "Kill Zone" ETHUSDT 1D: (Long Game Plan)
1. Market Context
On the Daily (1D) chart, Ethereum (ETHUSDT) has been consolidating within a high-level range between 2,400.00 and 2,550.00 (upper red box) inside the broader expansion structure (blue box). Price is currently pulling back toward the lower red accumulation box near 2,200.00 – 2,250.00, setting up a major liquidity-sweep buy setup before an explosive rally toward the macro 2,936.12 "Kill Zone".
2. Sentiment & House Trap Analysis
• Where Traders Place
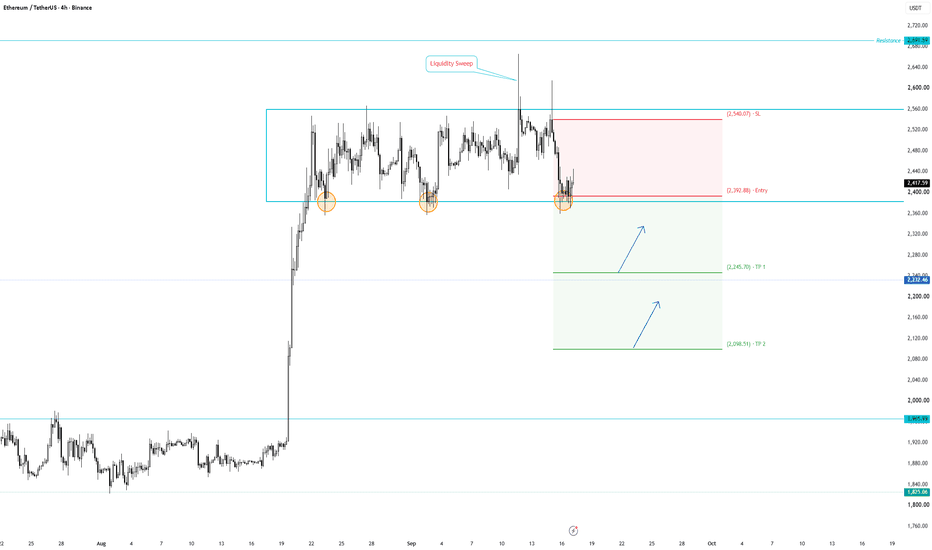
High-Level Range Breakdown & Upper Liquidity Sweep (Short Setup)ETHUSDT 4H:
1. Market Context
On the 4H chart, Ethereum (ETHUSDT) has been consolidating inside a multi-week horizontal range between 2,392.88 and 2,560.00. Price recently executed a sharp "Liquidity Sweep" wick above the 2,560.00 ceiling, followed by a violent rejection back into the box. Price is now pressing down to break the lower range support floor at 2,392.88.
2. Sentiment & House Trap Analysis
Where Traders Place Orders: Retail buyers are opening BUY positions around the triple-touch
Potential 4X on EURAUDI am looking for a quick liquidity grab around 1.6138, followed by a brief rally toward 1.6360.
We can anticipate the required volume to come in between 17 September 2026, 10:00 AM WAT and 18 September 2026, 2:00 PM WAT.
If the expected volume enters within this window, I anticipate the move could continue through to 29 September 2026, 6:00 AM WAT.
Trade Parameters
Entry: 1.6138
Stop Loss: 1.6080
Target is As stated on the chart
R:R: ≈ 1:3.83
Probability: 70% ( my current assessment of t
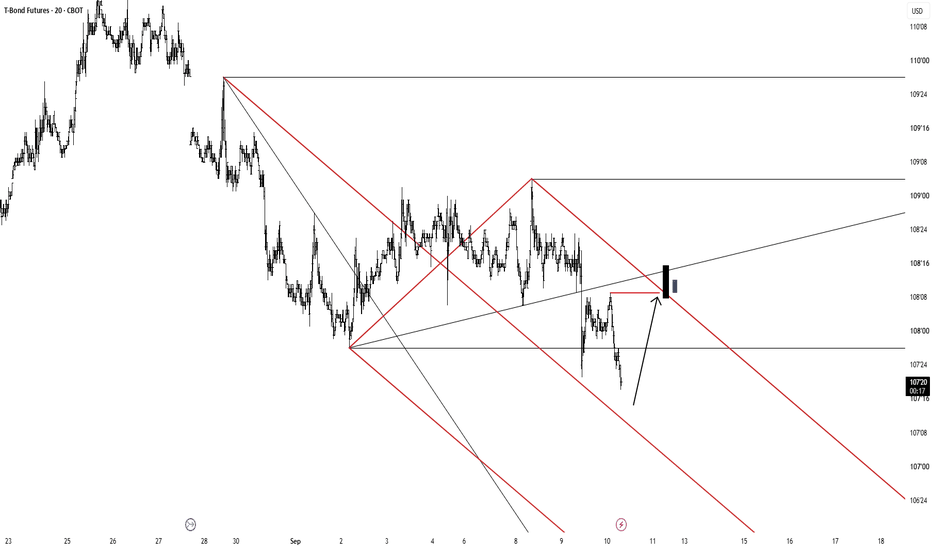
Willing to short bonds if I get the chanceBonds have been falling hard and, by the looks of it, they want to keep falling:
So I'm going to follow the trend. Nothing more, nothing less.
If I get a pullback, I'll look for a short at higher prices, in what would be called "resistance."
Both the 4-hour chart and this 20-minute chart are frameworks of my model, meaning my system is running. I'm taking that signal.
The stop for this market is 8 ticks. Those 8 ticks are represented by the black rectangle. The stop must be placed above a
PANIC LOW 11/16 2026 f 20 from covid low 3/23/20 spiral The chart is part of my spiral turn work .I see the low in the coming panic on 11/16 it will mark the second low the first is 10/16 or it is the point in which real bad things will occur and we should see chaos I feel it will be due to the events of issues with the timing of the election !!best of trades WAVETIMER !