BULLISH GARTLEY SETUP DEVELOPING ON DASH/USDDash is on the verge of completing a bullish Gartley pattern on the daily chart.
To keep it simple, this could mark the beginning of the strongest bullish move Dash has seen in years.
Do what you want with this information. I'm simply sharing what I believe is a high-probability setup.
Blue pill or red pill—the choice is yours.
Gartley
Siemens Healthineers — Gartley Completion at Historical OBSiemens Healthineers is currently trading inside a technically important reaction zone on the daily chart.
The core element of this setup is a clearly developed bullish Gartley pattern. What makes the structure particularly relevant is its origin: the pattern begins at the historical low and therefore incorporates one of the most important long-term reference points visible on the chart.
After the corrective decline from the previous swing high, price has now reached the projected Gartley completion area and has already shown an initial reaction from the Potential Reversal Zone.
Gartley Completion Zone
The central Gartley completion level is located around 32.70 EUR.
This area corresponds to the 78.6% retracement of the original XA leg and represents the primary Point D projection of the pattern. Price has reacted from this zone and is currently attempting to stabilize above it.
The broader Gartley PRZ extends below the central completion level. This is important because harmonic reversal zones should not be interpreted as one exact price, but as a technical area in which a reversal structure may develop gradually.
Historical Order Block Confluence
The strongest structural confluence is located slightly below the Gartley completion level.
The Order Block around 28.50–30.00 EUR originates from the historical low that also forms the starting point of the Gartley pattern. This gives the zone additional technical relevance.
The setup therefore combines:
* A clearly developed bullish Gartley pattern
* A Point D completion near 32.70 EUR
* A long-term Order Block derived from the historical low
* A potential exhaustion area after the previous corrective decline
The Gartley completion zone provides the first reaction area. The historical Order Block acts as a deeper support layer if price retests the lower part of the PRZ before a sustainable recovery develops.
Expected Scenario
The preferred scenario is a stabilization above the Gartley Point D area, followed by a gradual recovery toward the Fibonacci retracement targets above.
The first major objective is the 38.2% retracement near 42.34 EUR.
If the recovery develops with sufficient strength and forms a constructive higher-low structure, the next upside targets are:
* TP1: 42.34 EUR
* TP2: 48.28 EUR
* TP3: 52.50 EUR
* TP4: 57.89 EUR
A temporary retest of the lower PRZ remains possible. Such a move would not automatically invalidate the bullish scenario, especially if buyers react inside the historical Order Block.
Invalidation
The bullish recovery scenario becomes weaker if price loses the lower boundary of the Gartley PRZ and fails to react from the historical Order Block.
The deeper invalidation level is located below approximately 27.86 EUR.
A sustained move below this area would indicate that the long-term support structure has failed and that the Gartley reversal scenario is no longer valid.
Conclusion
Siemens Healthineers has completed a well-defined bullish Gartley pattern whose structure begins at the historical low.
The confluence between the Gartley PRZ and the historical Order Block creates a technically relevant support area between approximately 28.50 and 32.70 EUR. The initial reaction from Point D is constructive, but the market still needs to confirm that buyers can stabilize price above this support structure.
As long as the broader PRZ remains intact, a recovery toward the first Fibonacci target near 42.34 EUR remains the preferred scenario.
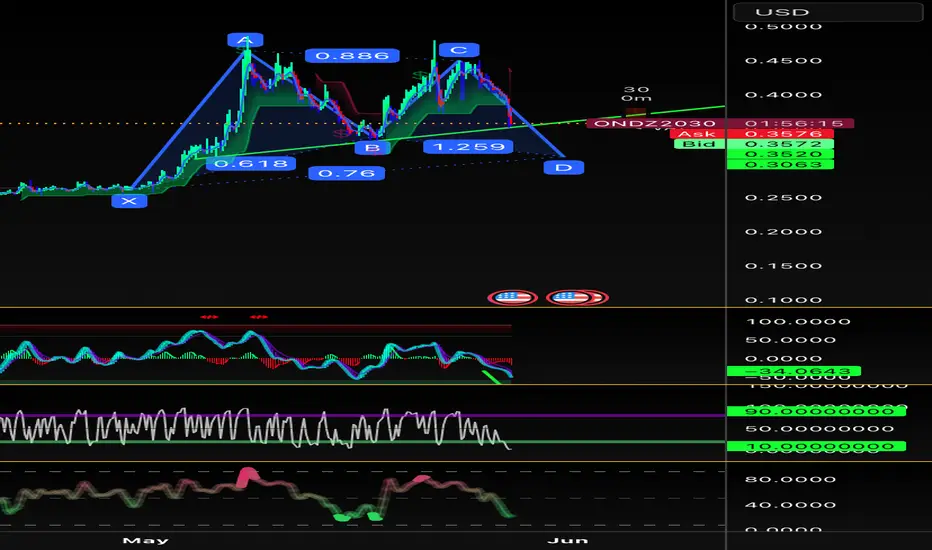
Ondo short to .3069 will complete bullish Gartley D swingOndo short is back on after letting macd and rsi cool off targeted measured move is still .3069<(price shown on chart is lower but I’m too lazy to change it) and if it ends near this price on Saturday at 20:20 the complete Gartley D swing will have ended on target to reverse position to .8869 but it’s important it completes near the proper time within an few hours and is in the price zone (.3069) to apply to a Gartley pattern.
Giant Ondo bullish gartley forming?Ondo broke out of a lower channel earlier and a double top neckline which targets the .3069 area with its measured move down. ie; measure the high of the biggest top to its neckline resistance and project that same height down from the neckline to get your measured move. And I was just playing around checking the big pattern of its cycle high price action and every measurement so far lines up with a bullish gartley pattern if this measures move goes where I think it is it’s going to form a nice entry point for a long after this big correction. Interested what other people think about this if anyone is interested in sharing. Also the Ondo short to 3069 is still in play at the moment of posting it’s hit it’s midpoint support to gain bullish stop loss liquidity zones and let macd/rsi normalize but the upward channel is very much likely a trap only trade it if you are in it briefly or you will get stopped out I’m sure. The whale is also using this as a zone to sell off the liquidity it consumed from the top.
Trading Plan: Weibo Corporation (WB) – US StockTrading Plan: Weibo Corporation (WB) – US Stock
Timeframe: Daily (D1)
Current Price: $8.07
Direction: Long (Bullish)
Strategy: Pullback entry + multi-target scaling + trailing stop
1. Entry Setup
• Wait for pullback on lower time frame to confirm demand zone.
• Entry Price: $7.60
2. Stop Loss
• Stop Loss: $6.80
• Risk per share: $0.80
3. Take Profit Levels & Scaling Plan
• TP1: $10.30 – Close 50% position → move SL to break-even or small profit
• TP2: $13.66 – Close 50% of remaining → trail stop higher
• TP3: $18.50 – Close 50% of remaining → trail stop for final leg
• Last portion: Let run with market structure, trail stop dynamically
4. Risk-Reward Ratio
• Risk: $0.80
• Reward (TP3): $10.90
• RRR = 1 : 14.61
5. Trading Rationale (Brief)
WB is a US-listed Chinese social media stock (Nasdaq: WB) with stable revenue from advertising and membership services. Daily structure shows potential bullish reversal; waiting for pullback to demand zone for high-probability long entry.
6. Important Risk Disclosure (US Stock Trading)
Trading US equities involves substantial risk and may result in the loss of your entire capital.
• Market Risk: US stocks can be highly volatile; macro data, Fed policy, and geopolitics may trigger sharp gaps and slippage.
• Single-Stock Risk: Company earnings, regulatory changes, or delisting risk can cause sudden drops.
• Liquidity & Execution Risk: Lower liquidity in some sessions may lead to wider spreads and partial fills.
• Leverage Risk: If margin is used, losses can exceed initial deposits.
• This plan is for trade execution only, NOT financial advice. All decisions are your own.
HD Weekly Long Trading PlanHD Weekly Long Trading Plan
Symbol: HD
Timeframe: Weekly Chart
Trade Direction: Long
Entry: Enter long on lower timeframe pullback near $293.95
Stop-Loss: $269.00
Take Profit & Position Management:
1. First target near $350.00: Reduce half position and adjust stop loss for profit protection.
2. Second target near $408.00: Reduce half of the remaining position and trail stop loss again.
3. Third target near $485.00: Reduce half of the remaining position and keep trailing stop loss.
4. Let the last partial position run with the trend under trailing stop protection.
Risk Disclaimer:
US stock markets are affected by macroeconomic fluctuations, Federal Reserve policy adjustments, corporate earnings releases, sector capital flows and sudden news. There exists weekend gap risk and price slippage under high market volatility. All trading activities involve inherent risks. Please strictly control position size and adhere to stop-loss rules throughout the trade.
AVAX perp/futures bullish gartleyAVAX perp style futures has a bullish gartley pattern on the 15min timeframe. Gartley patterns are harmonic analogues of the bat pattern and have a very high win rate compared to triangles/wedges etc. The target price is the 1.618 of the a/d price swing. This scenario matches wycoffes theory as well because the price broke down past a lower support and matches the spring concept after the distribution phase and has made the coin build positive momentum from being highly oversold. The consolidation has taken shape as a symmetrical triangle after the gartley d movement.
GBPJPY Bull Gartley + Bullish Continuation TradeHey guys today we have a rare opportunity where we have two strategies providing confluence in the same direction. Now, although this isn't needed in order to trade Fibonacci based patterns, it does allow you to get more bang for you buck from them and I'll explain what that means in the video.
Also my apologies for the rushed video, as I was trying to get it done quickly since the pattern actually completed minutes before I started recording.
Hope you still got value from it.
Akil
/CL: Bearish Deep Gartley and Bearish Shooting Star Confirmed/CL seems to be furthering it's RSI Bearish Divergence as the price-action prints a Hanging Man followed by a Bearish Shooting Star, confirming an .886 entry for a newly developed Bearish Deep Gartley. This can serve as a good secondary entry against Oil, Market Volatility, and the DXY which may likely lead to a bounce in SPX, BTC, ETH, and perhaps Silver as detailed here:
I will be careful with gold and silver and SPX as those aren't exactly fixed assets not even Gold and Silver. The production of Gold and Silver rises with price so it's not a fixed asset they are just a bit more scarce than usual. But something like BTC and LTC are fixed supply assets and that's where most liquidity is likely to go, in addition to certain fundamentally good stocks.
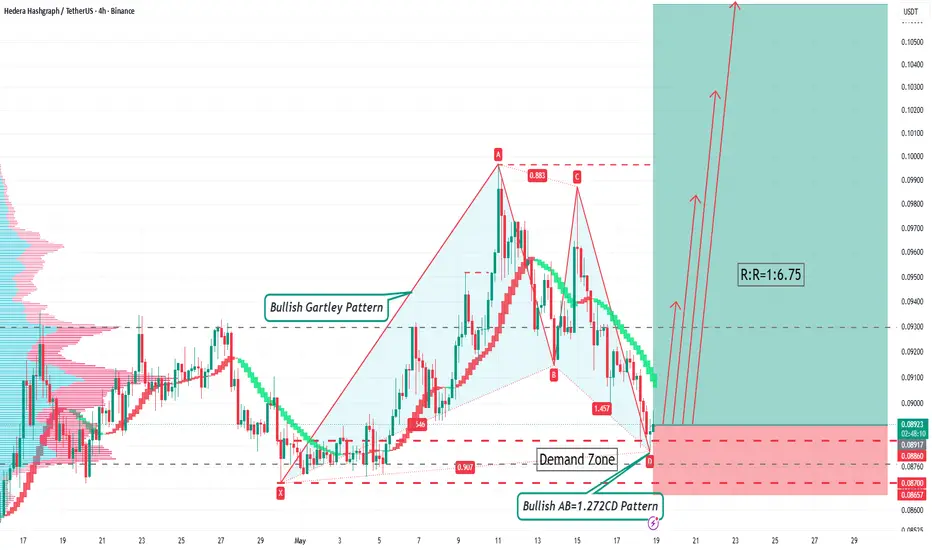
HBARUSDT 4H Trading PlanHBARUSDT 4H Trading Plan
Trading Pair: HBARUSDT
Timeframe: 4 Hour
Trade Direction: Long
Entry Price: 0.08922
Stop Loss: 0.0657
First Target: 0.09399
Cut half position and move stop loss to lock profit.
Second Target: 0.09825
Reduce half of remaining positions and adjust protective stop loss.
Third Target: 0.10285
Continue partial position reduction and shift stop loss upward.
Fourth Target: 0.10672
Make further position reduction, keep the last position and follow trend with trailing stop loss.
Crypto Trading Risk Warning
Cryptocurrency market features fierce price volatility and huge trading risks. Unexpected market news, liquidity shortage and policy changes may cause drastic price swings. Leveraged trading will enlarge both profits and losses, which may lead to total capital loss. This trading plan is only for technical reference, not any investment suggestion. All trading decisions shall be made by traders independently, and all investment risks shall be borne by yourself. Please strictly abide by risk control rules during transactions.
ENAUSDT 4H Trading PlanENAUSDT 4H Trading Plan
Timeframe: 4-Hour
Trading Pair: ENAUSDT
Trade Direction: Long
Entry Price: 0.1048
Stop Loss: 0.0980
First Target: 0.1185
Close half of the position and move stop loss to secure profits.
Second Target: 0.1328
Reduce half of the remaining positions and adjust stop loss for further protection.
Third Target: 0.1558
Reduce partial positions again and trail stop loss higher.
Keep the last partial position running with dynamic trend protection.
Crypto Trading Risk Warning
Cryptocurrency trading has high volatility and substantial investment risks. Market fluctuations, insufficient liquidity and unexpected news can cause fund losses. Leverage magnifies both gains and risks. All trading plans are only technical references, not investment suggestions. Please implement strict risk management and trade at your own risk.
Trading Plan — EUR/CADTrading Plan — EUR/CAD
Timeframe: 2H Chart
Direction: Long
Entry Price: 1.60530 (Market entry directly)
Stop-Loss: 1.60160
Profit Targets & Position Management
TP1: 1.61161
• Reduce 50% of total position
• Move stop loss to breakeven for profit protection
TP2: 1.61678
• Reduce 50% of the remaining position
• Adjust stop loss to 1.61161 for profit lock
TP3: 1.62280
• Reduce 50% of the remaining position
• Adjust stop loss to 1.61678 for profit protection
The last small trailing position shall be held with dynamic stop-loss adjustment following the trend.
Risk Warning
This trading plan is only for reference and educational purposes, not investment advice. Forex trading carries high market risk, and technical support/resistance levels may fail at any time. Please strictly enforce stop-loss rules and position management, only trade with risk capital you can afford to lose. Past performance is not indicative of future market results.
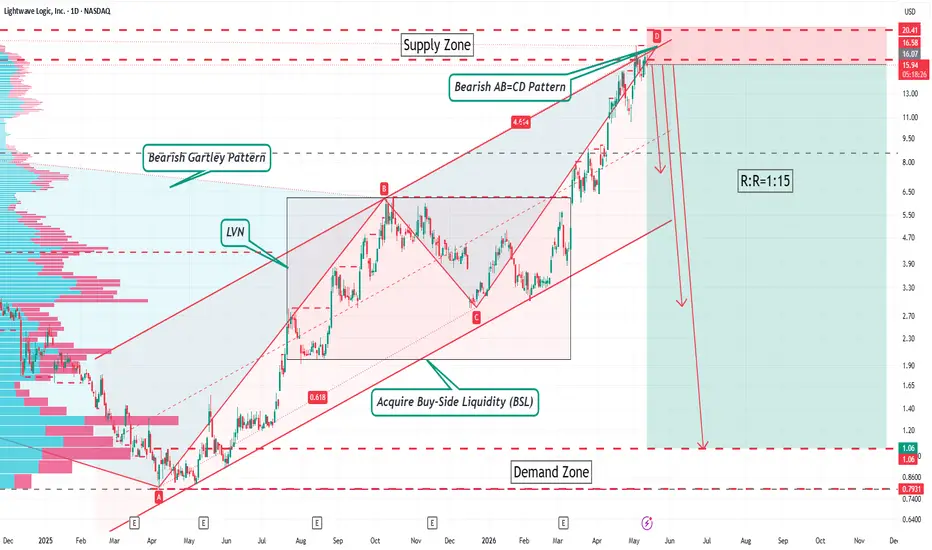
LWLG Daily Short Trading PlanLWLG Daily Short Trading Plan
Symbol: LWLG
Timeframe: Daily
Direction: Short
Entry Price: 16.07
Stop Loss: 20.50
Take Profit & Position Management
1. First Target: 7.30 - Reduce half position, move stop loss to breakeven
2. Second Target: 2.80 - Reduce half of remaining position, adjust protective stop loss
3. Third Target: 1.00 - Reduce half of remaining position, adjust protective stop loss
4. Final Position: Hold remaining position with trailing stop loss
Risk Disclaimer
US stock trading faces huge price volatility, unexpected fundamental news and abnormal market fluctuations. All trades carry great investment risks. Please strictly abide by stop-loss rules, control position size reasonably and avoid reckless trading.
SOL/USDT 4H Trading PlanSOL/USDT 4H Trading Plan
Trading Pair: SOL/USDT
Time Frame: 4-Hour
Trade Bias: Short
Entry Price: 95.20
Stop Loss: 98.00
Take Profit Levels & Position Management
1. First Target: 89.50
Close half of the position and move stop loss to protect profits.
2. Second Target: 84.50
Reduce position again and continue trailing the stop loss.
3. Third Target: 78.50
Cut more position and keep trailing stop loss for the remaining lots.
4. Remaining Position:
Follow the market trend with continuous trailing stop loss.
Risk Disclaimer
Cryptocurrency markets are highly volatile with risks of false breakouts, price spikes and liquidity slippage.
Strictly execute stop loss without holding losing positions or modifying the trading plan arbitrarily.
Exit immediately if the technical structure and trading setup are invalidated.
This analysis is for reference only and does not constitute any investment advice.
HYPE/USD H4 Short Trade PlanHYPE/USD H4 Short Trade Plan
Instrument: HYPE/USD
Timeframe: H4 (4 Hour)
Trade Bias: Short Sell at 50% retracement of large bearish candle
• Entry: Around 44.04962499
• Stop Loss: Around 45.75700780
• TP1: 41.46884020 → Close 50% position, move SL to break-even
• TP2: 39.39286670 → Reduce position, adjust SL to lock profit
• TP3: 36.450688778 → Partial exit, trail stop loss for profit protection
• Remaining position: Hold with trailing stop protection
Risk Disclaimer
Cryptocurrency trading carries extremely high volatility and unpredictable market risks. Sharp price swings, liquidity risks and regulatory changes may cause sudden losses. All analysis is for educational purposes only, not investment advice. All trading profits and losses shall be borne by traders personally.
MERL Daily Chart Short Trading PlanMERL Daily Chart Short Trading Plan
Basic Information
• Trading Asset: Mears Group PLC
• Timeframe: Daily timeframe, swing trading
• Expected holding duration: 3–8 weeks (1–2 months)
• Trade Direction: Short
Entry & Exit Levels
• Entry: Near 402.0
• Stop Loss: 422.0
Exit immediately once stop loss is triggered.
• TP1: Near 368.50
Close half position, move protective stop to break-even.
• TP2: Near 347.0
Close half remaining position, raise protective stop further.
• TP3: Near 322.00
Close half remaining position, tighten trailing stop loss.
• Remaining Position: Hold with dynamic trailing stop, no fixed final target.
Risk Warning
US stock market is heavily impacted by macro events, market volatility and corporate fundamental news.
Bearish structure fails if stop loss broken. Always execute stop loss strictly, never average down losing positions.
Manage position size properly for long-term swing trades. Do not over-allocate capital into single stock.
Follow position reduction and trailing stop rules strictly. Lock profits and control risks, never alter levels impulsively.
Trading Discipline
Follow planned levels rigidly. Adjust protective stop promptly after every partial exit.
Protect principal capital and secured profits steadily.
MShort
NZDUSD 4H Trading PlanNZDUSD 4H Trading Plan
Trading Instrument: NZDUSD
Timeframe: 4 Hours
Current Price: 0.59654
Long Trade Setup
1. Wait for price to break above 0.59915 and complete Sweep SSL Liquidity (sell-side liquidity sweep).
2. Enter long position after bullish confirmation, price must not break below 0.59539 to form a valid Structure Flip support.
3. Take Profit: Target at the completion zone of Bearish Gartley Pattern & Bearish AB=CD Pattern, near 0.60570.
Subsequent Short Trade Setup
After price reaches the TP level 0.60570, prepare for reverse short position trading.
Initiate short setup based on bearish reversal confirmation at the harmonic pattern completion zone, following daily trend structure and supply zone resistance.
Risk Warning
1. Market structure may shift unexpectedly, and false breakout & liquidity hunt may occur at any time. Strictly abide by risk management rules.
2. Do not overtrade, and strictly set stop loss for both long and short positions to control single-trade risk.
3. This trading plan is only for technical analysis and pattern reference, not investment advice. Please trade at your own risk.
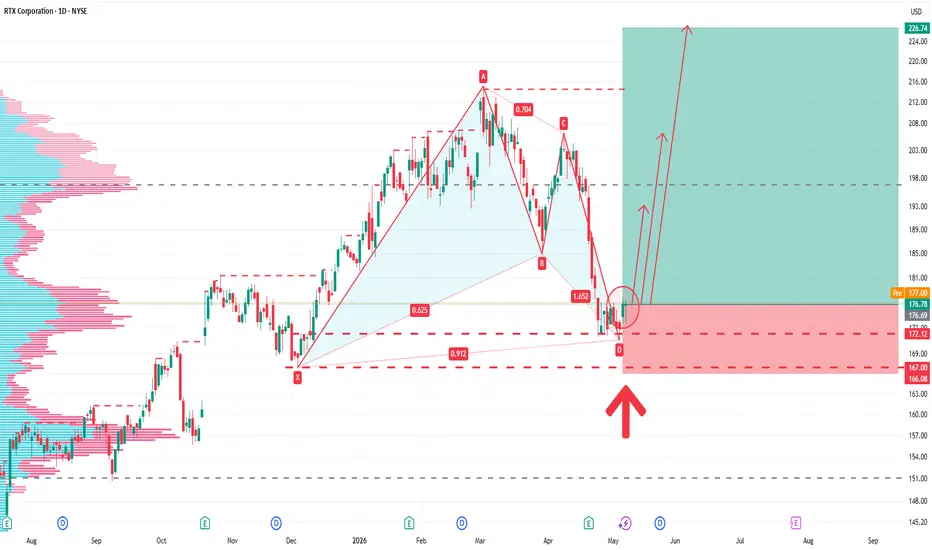
RTX Daily Long Trading PlanRTX Daily Long Trading Plan
Stock Symbol: RTX (Raytheon Technologies)
Timeframe: Daily
Trading Direction: Long
Entry Price: Around $176.78
Stop Loss: $166.00
TP1: Around $195.00
Close 50% position, move stop loss to breakeven.
TP2: Around $208.00
Close half of remaining position, trail stop loss to lock profits.
TP3: Around $225.00
Reduce half of leftover position, continue trailing stop protection.
Remaining Position: Hold with trailing stop loss and follow market trend to exit.
Risk Warning
U.S. stock market is affected by geopolitics, Federal Reserve monetary policy, corporate earnings and macroeconomic data, with large price volatility. There exists risk of principal loss. Strictly abide by stop-loss discipline, do not arbitrarily adjust stop-loss levels or over-positioning. This plan is only technical reference, not investment advice. All transactions shall be based on personal risk tolerance.
XAGUSD TP 88.85On the daily chart, XAGUSD has stabilized and is trending upward, with short-term bullish forces holding the advantage. Currently, attention should be focused on the resistance level near 83.05; a breakout above this level would likely pave the way for further gains, with an upside target set around 88.85. Should the price reach the vicinity of 88.85, watch for the potential formation of a bearish Gartley pattern.